How to build an advertising spends tracking tool in Looker Studio?
Need to track your advertising spends in Looker Studio, but not sure how? Check this article, we’ve got it covered for you !
Are you the owner of a business that is running loads of on-line ads, or directly an agency? If so, I bet you’ve got several employees fully dedicated to the topic. Online advertising is hard, very hard. You can be on tens of platforms, run hundreds of campaigns, with thousands of ads variations… In order to be able to analyze the huge amount of data you’re generating, we’ll show you here how to build an advertising spends tracking tool in Looker Studio.
This way, you’ll know where you’re getting a good ROAS (Return on Ads Spend), when to stop particular campaigns, when to double down, and when to shift investments from one platform to another. In other words, we’re giving you the key to track, monitor & manage your advertising strategy, no more no less!
Top Looker Studio connectors we love and use on a daily basis (all with free trials): PMA - Windsor - Supermetrics - Catchr - Funnel - Dataslayer. Reviews here and there.
Not sure which one to pick? Have a question? Need a pro to get a project done? Contact us on LinkedIn or by e-mail, and we’ll clear up any doubt you might have.
Looking for Looker Studio courses? We don’t have any… but you can check Udemy!
1/ List platforms you’re running ads on
First of all, which platforms are you running ads on?
The most common ones are Google Ads & Meta Ads (Facebook & Instagram), 99.9% of our clients are on both. Regarding the rest of platforms, there can be differences based on the type of products/services you’re selling and your target audience.
Some clients spend more on LinkedIn Ads for “serious business”, other go to TikTok Ads to sell the “cool products”.
We wouldn’t recommend to be on more than 4/5, after that it becomes hard to manage (and, yes we know there are tools that allow you to spend across platforms, but then managing performances can be very challenging, knowing that a single campaign can perform well on a platform and badly on another, let’s not add too much complexity yet).
2/ Select the right third-party connectors
Once you’ve reviewed the list of platforms you’re using, compare third-party connectors and check that they offer integrations for all the ones you’re using. Tools we like:
Once you’ve choosen a connector, set up the integrations, create the data sources in a new report in Looker Studio. The interesting part is coming!
3/ Blend data to be able to compare performances across performances
Before jumping into building any dataviz, you need to create a blended data of your different data sources (Google Ads, Meta Ads, …), so all your data will come from a single data source, and you’ll then be able to make comparison. No worries, we’ve got an article to help you!
4/ Top metrics to track, split by top dimensions
At this stage, you should have a blended data up and ready to build meaningful dataviz.
But what metrics should you track? Again, this article on Best practices to monitor your ads performances should help you, but in a nutshell, you should track the following:
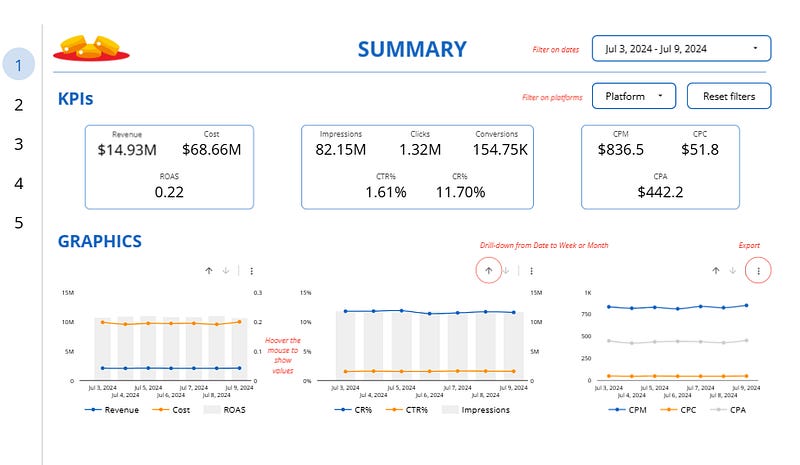
Impressions, Clicks & Conversions
Revenue, Cost & ROAS
CTR% (Click Through-Rate) & CR% (Conversion Rate)
CPM (Cost per mille impressions), CPC (Cost per Click) & CPA (Cost per Acquisition)
Split by the following dimensions:
Dates (Day, Week, Month)
Platforms (Google Ads, Meta Ads, Linkedin Ads, Twitter Ads, TikTok Ads, …)
Campaigns (allowing comparing within and across platforms!)
We’re talking 3 to 5 pages, like in this report:
And that’s it folks!!!
You now have a strong Looker Studio dashboard to track, monitor & manage what’s occuring with your Advertising spend campaigns. You’re very welcome :)
In this article, we’ve reviewed how to build an advertising spends tracking tool in Looker Studio.
PROBLEM SOLVED !
Top Looker Studio connectors we love and use on a daily basis (all with free trials): PMA - Windsor - Supermetrics - Catchr - Funnel - Dataslayer. Reviews here and there.
Not sure which one to pick? Have a question? Need a pro to get a project done? Contact us on LinkedIn or by e-mail, and we’ll clear up any doubt you might have.
Looking for Looker Studio courses? We don’t have any… but you can check Udemy!
Communicate and browse privately. Check Proton Mail and Proton VPN
Website hosted by Tropical Server

