How to display Facebook Ads and Google Ads metrics in the same table in Looker Studio?
Tired of having different tables for Facebook Ads data, Google Ads data, ….? Here, we’ll show how to display all metrics in the same table
Let’s say you’re advertisting your website using different channels (Google Ads, LinkedIn Ads, TikTok Ads, …). I bet you want to be able to track and compare performances between channels to invest your money where you’ve got the best ROI. The easiest way would be to have one table summarizing all data. But how to build such a table if you’re using different data sources? Well, using Blended Data of course!
In this article we’ll show you how to display both Facebook Ads and Google Ads metrics in the same table in Looker Studio (formerly known as Data Studio)? But really, can be applied to any data sources once you’ve figured how it works, plus you can add as many channels as you want! Let’s see how to do this.
Top Looker Studio connectors we love and use on a daily basis (all with free trials): PMA - Windsor - Supermetrics - Catchr - Funnel - Dataslayer. Reviews here and there.
Not sure which one to pick? Have a question? Need a pro to get a project done? Contact us on LinkedIn or by e-mail, and we’ll clear up any doubt you might have.
Looking for Looker Studio courses? We don’t have any… but you can check Udemy!
First, blend data on dates and using a custom field
For this example we’ll be using a Facebook Ads data source and a Google Ads data source. We’ll compare Impressions and Clicks for a given period.
First, please create a Blended Data, using your Facebook Ads connector as Table 1 and Google Ads connector as Table 2. We’ll give them names so it’ll be easier to recognize metrics later on.
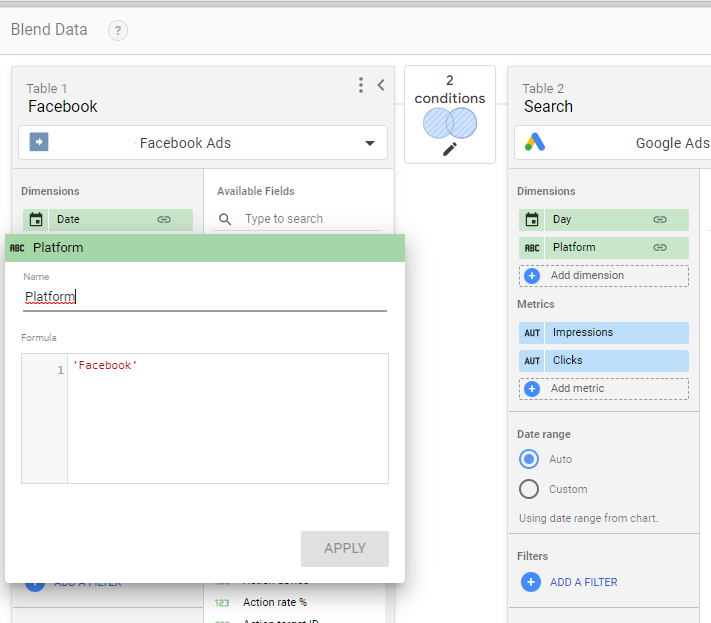
For Facebook Ads, we’ll take as dimensions the Date, and we’ll also create a custom field by clicking on Add a dimension, name it Platform, and just insert ‘Facebook’ in the formula:
As per the metrics, we’ll just take Impressions and Clicks (all).
Similarly, for the Google Ads table we’ll use the Date field as a dimension (called Day here), and the Platform custom field with ‘Google’ in the formula.
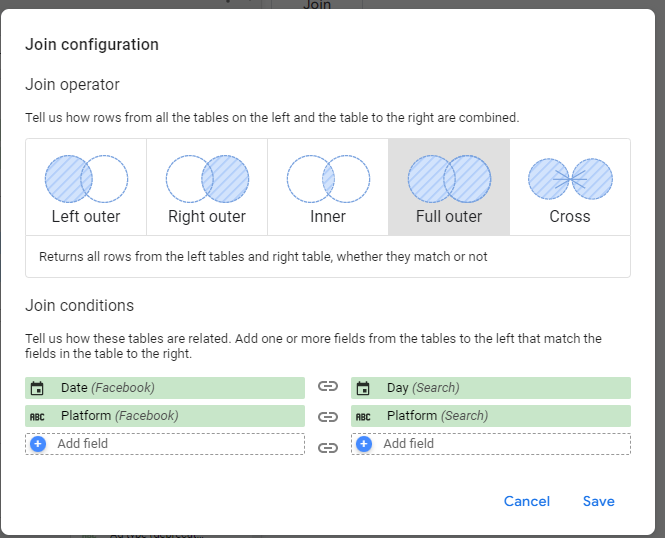
We’ll do a Full Outer join on both dimensions:
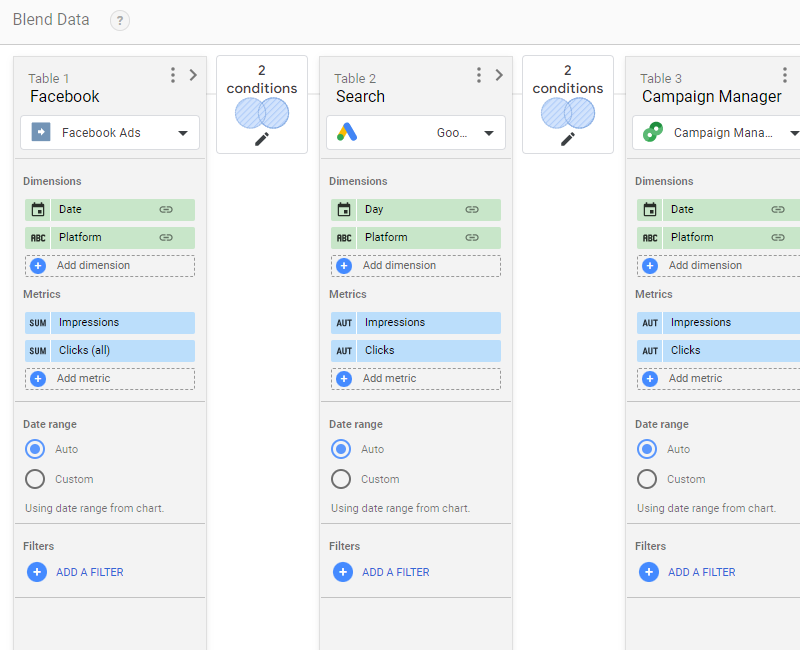
And this is what you should see at this stage. Please note that you can add up to 6 data sources to be blended, just replicate the steps we’ve followed, always using full outer joining. Here for instance I added a Campaign Manager data source as well:
Please save the blended data. You’re almost there!
Then, use COALESCE function in your table to display all data at once
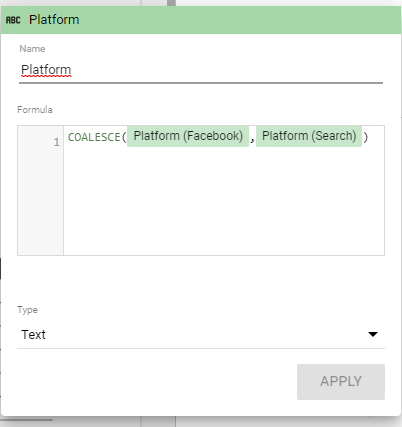
Now, please Add a table. As per the dimension, we’ll use the following formula:
And for the metrics, these will be the formulas:
SUM(COALESCE(Impressions (Facebook),Impressions (Search)))
SUM(COALESCE(Clicks (all),Clicks))
Don’t you worry if the field are in red in the Setup ribbon, it works just fine. Please note that if you’ve got more channels, you just have to add more parameters to the COALESCE function.
For instance, with Facebook Ads, Google Ads and a Campaign Manager data source, it’d be as follow:
SUM(COALESCE(Impressions (Facebook),Impressions (Search),Impressions (Campaign Manager)))
And that’s it! You now have a nice table with all metrics, ready to be compared. From there you can build custom metrics and see where to best invest your money :)
In this article, we’ve reviewed how to display Facebook Ads and Google Ads metrics in the same table in Looker Studio.
PROBLEM SOLVED !
Top Looker Studio connectors we love and use on a daily basis (all with free trials): PMA - Windsor - Supermetrics - Catchr - Funnel - Dataslayer. Reviews here and there.
Not sure which one to pick? Have a question? Need a pro to get a project done? Contact us on LinkedIn or by e-mail, and we’ll clear up any doubt you might have.
Looking for Looker Studio courses? We don’t have any… but you can check Udemy!
Communicate and browse privately. Check Proton Mail and Proton VPN
Website hosted by Tropical Server


