Some useful date formulas, formats, ranges, calculated fields… in Looker Studio
It’s all about dates. In this article we’ll share with you some useful date formulas, formats, ranges, calculated fields… in Looker Studio
Dates. It’s all about dates. In this article, we’ll share with you some useful date formulas, formats, ranges, calculated fields… in Looker Studio. We hope you’ll find this helpful, and don’t hesitate to comment if you’ve facing a date challenge and would like us to add a section. Enjoy the reading :)
Top Looker Studio connectors we love and use on a daily basis (all with free trials): PMA - Windsor - Supermetrics - Catchr - Funnel - Dataslayer. Reviews here and there.
Not sure which one to pick? Have a question? Need a pro to get a project done? Contact us on LinkedIn or by e-mail, and we’ll clear up any doubt you might have.
Looking for Looker Studio courses? We don’t have any… but you can check Udemy!
First, check our existing articles
Over the course of a couple of years (already!), we’ve written a few date articles, so can check them first!
We must say, we’ve been quite active on this topic ^^ Still, there are some other tips&tricks we haven’t shared yet!
When will my stock get to 0?
So, let’s say you’ve a got a data source with stocks (always the same value) and sales by date. And you want to know when your stock will hit 0 (so you know when to re-order for instance and prevent running out of a given product).
First, let’s find out the daily sales rate. Pretty easy:
SUM(sales)/COUNT_DISTINCT(date)So if you made 12 sales over the past 3 days, you know you’re selling 4 per day (in average).
Then, knowing you’ve got a stock of 24, how many days will it take to get to stock 0? Well, this formula will give you the answer:
AVG(stocks) / (SUM(sales)/COUNT_DISTINCT(date))With a daily rate of 4 sales, and a stock of 24, it’ll take 6 days from today to get to stock 0, you got that. But how do we translate that into a date? Well, using DATETIME_ADD:
DATETIME_ADD(CURRENT_DATE(),INTERVAL AVG(stocks) / (SUM(sales)/COUNT_DISTINCT(date)) DAY)And that’s it: this formula will add 6 days to today, hence it will return the estimated date when the stock will get to 0. Useful no?
Obviously, based on the way stocks and sales are stored in your data source, you might have to adapt a bit, but that’s a useful formula we’ve used widely for our e-commerce clients. Don’t hesitate to contact us if you need help.
Change date formats to something unique
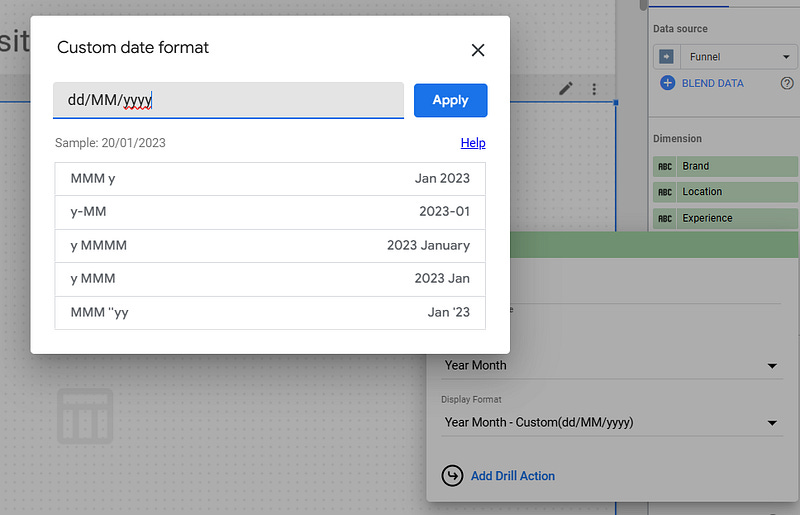
At this stage, we believe you know how to change the format of a date to return Week & Isoweek, Month, Year, … But what if you needed something more specific?
Well, pretty easy. Edit your date field by clicking on the arrow left of the dimension name, click on Display Format, Custom date format… at the bottom, and then you’re free to set it up exactly the way you want. Check documentation for formats definition, but you can play with what you want to show as well as separators, possibilities are endless:

Show abbreviated Month name and Year
This one took us some to figure out, but we eventually did it! The formula below will help you get exactly this:
FORMAT_DATETIME('%b %y',DATETIME_TRUNC(Date,MONTH)) Again, looking at documentation will help you find correspondances between date parts and the %letter associated.
Blending data on dates does not work
Classic one. Usually, although you believe you’re joining DATE on DATE, you’re actually joining DATE on DATETIME, hence the issue. Make sure that both of your blending fields share the same format (same issue could arise if you’re joining WEEK on MONTH, …).
Ease the date filtering with controls to replace the default date range
Sometimes, you want to filter on long periods of time, months if not years, and using the default date range control is not of great help.
What you can do instead: set the default date range to the maximum period available, and then create controls on calculated fields like YEAR(date), MONTH(date), … This way, each control will allow you in 2-clicks to display what you want, without having to suffer with the default date range control.
Calculate daily averages
Sometimes having daily averages is useful. Thing is, and especifically if you’re using third-party data sources, you cannot just average your metric as it will show phony results (not getting into too much details but if your data is split through several dimensions, Looker Studio doesn’t always understand you want the daily averages, it gives you the average based on available dimensions). Hence, the formula below:
SUM(sales)/COUNT_DISTINCT(date)And that’s it for today folks. Anything we’ve missed?!
PROBLEM SOLVED
Top Looker Studio connectors we love and use on a daily basis (all with free trials): PMA - Windsor - Supermetrics - Catchr - Funnel - Dataslayer. Reviews here and there.
Not sure which one to pick? Have a question? Need a pro to get a project done? Contact us on LinkedIn or by e-mail, and we’ll clear up any doubt you might have.
Looking for Looker Studio courses? We don’t have any… but you can check Udemy!
Communicate and browse privately. Check Proton Mail and Proton VPN
Website hosted by Tropical Server
