How to use several date range controls on a same page in Looker Studio?
Do you want to offer the best user experience in a Looker Studio dashboard? Consider using several date range controls, make them cool !
Date range controls are very useful in Looker Studio & Data Studio to play around with your data. One click here, one click there, and boom all your dataviz are instantaneously updated, and everyone is happy.
But sometimes, you want dataviz to reflect data on different date ranges, and you’re not sure how to best do it.
No worries, in this article, we’ll review how to use several date range controls on a same page so you can give your final users exactly the experience you want (dynamic date range charts here, fixed date range KPIs there, ….).
Top Looker Studio connectors we love and use on a daily basis (all with free trials): PMA - Windsor - Supermetrics - Catchr - Funnel - Dataslayer. Reviews here and there.
Not sure which one to pick? Have a question? Need a pro to get a project done? Contact us on LinkedIn or by e-mail, and we’ll clear up any doubt you might have.
Looking for Looker Studio courses? We don’t have any… but you can check Udemy!
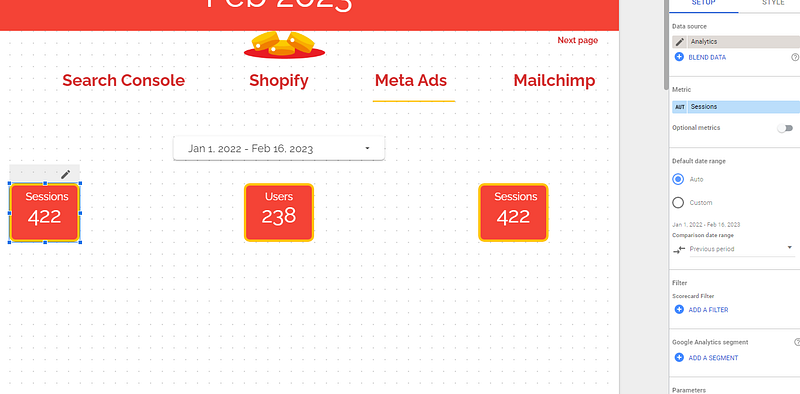
What happens when you have one page-level date range control, and all dataviz set to Defaut
That’s the default use case. Quite simple to understand, the date range control controls all dataviz on the page, period.
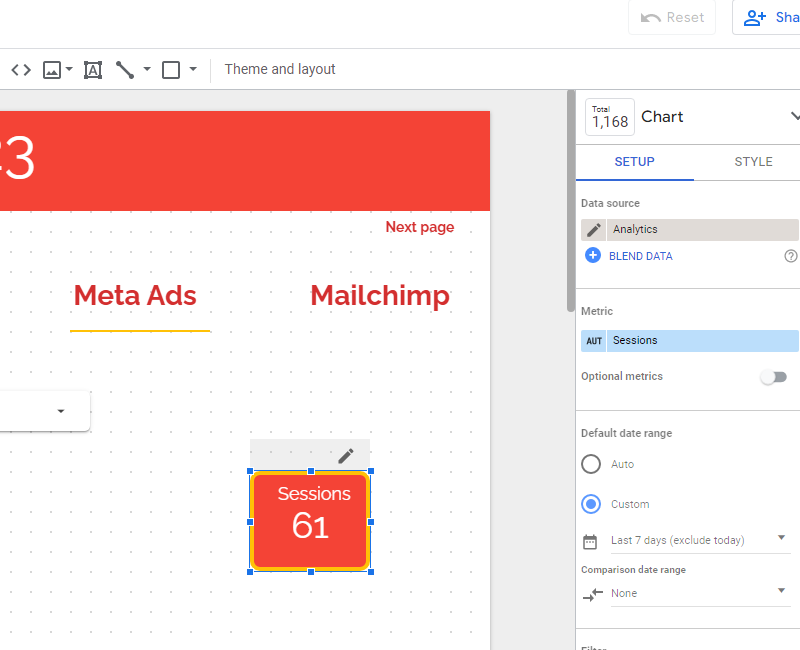
What happens when you have one page-level date range control, and one dataviz set to Custom
In this case, the date range control controls all dataviz set to Default, but not the dataviz set to Custom. The dates you’ve choosen in the setup ribbon override the date range control, and Viewers cannot change it. Good when you want a dataviz defaulted to last 7 days, last month, …
What happens when you have several page-level date range controls
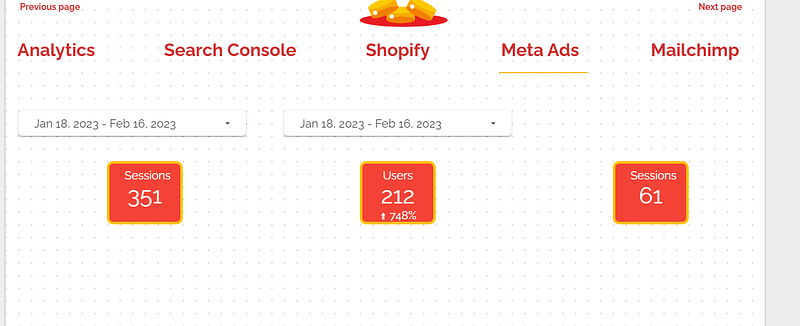
Here comes the funky stuff. Let’s say you added by mistake two date range controls one next to the other, all dataviz being set to default.
What happens if you change the dates on the first one? Well, dates get updated on the second one as well.
You might think this is redundant, but is can be pretty useful if you’ve got a very long report (like height of 5000px). You don’t want your viewers to scroll up and down to change the dates, so you put several date range controls in different places, ensuring a smoother user experience.
What happens when you have a page-level date range control and a report-level date range control
You should not do that. In this case, the report-level date range control is useless, it’s the page-level that takes over control.
Group components so different date range controls control different dataviz
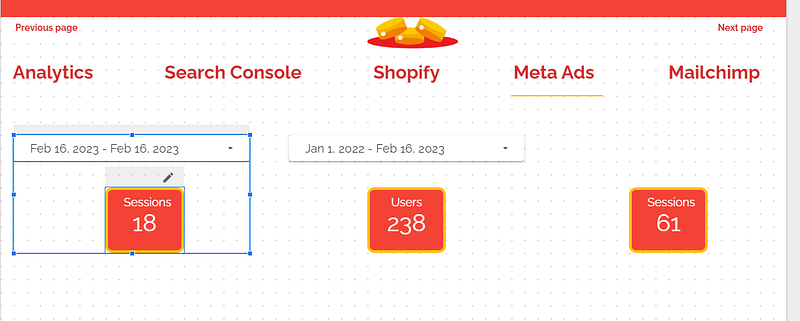
Last case we’re reviewing today, what if you wanted to have different controls control different dataviz? Just group them.
With your mouse, select a date range control along with a dataviz, then right-click, and then Group. What happens now? The dataviz grouped will be controlled by the corresponding date range control. The un-grouped dataviz will be controlled by the page-level date range control. And the custom dataviz remains custom, not impacted by any control.
In this article, we’ve reviewed how to use several date range controls on a same page, so you can offer the best experience to your users. Want dataviz to show always the same date range (last 7 days, last month, …)? Custom. Want dataviz to have a specific date range? Group. Want to ease the life of your users facing a very long dashboard? Place several date range controls along your page.
PROBLEM SOLVED !
Top Looker Studio connectors we love and use on a daily basis (all with free trials): PMA - Windsor - Supermetrics - Catchr - Funnel - Dataslayer. Reviews here and there.
Not sure which one to pick? Have a question? Need a pro to get a project done? Contact us on LinkedIn or by e-mail, and we’ll clear up any doubt you might have.
Looking for Looker Studio courses? We don’t have any… but you can check Udemy!
Communicate and browse privately. Check Proton Mail and Proton VPN
Website hosted by Tropical Server


