
How to split Analytics conversion by Search Console keywords in Looker Studio?
Split your Analytics conversion by Search Console keywords in Google Looker Studio to optimize your SEO!
If your website is well configured and you are doing your job to track its performances, you should be looking on a regular basis at Google Analytics and Google Search Console. The first tool gives you information regarding conversions (but everything we will be discussing here could be applied to goals as well), and the second one gives you information regarding keywords clicks.
So far so good. But what if you wanted to know what are the conversions by keywords? Indeed, you might be spending a lots of efforts and money to generate clicks on keywords that actually don’t generate conversions, whilst other low-clicked keywords are showing a super duper conversion! And this information is quite hard to get from Analytics and Search Console. How can you do that in an elegant manner?
Using Blended Data my dear Watson!
We’re going to use a GA4 property and a Search Console data source attached to the same website to do so. Spoiler: it won’t be perfect, but it’ll be the best estimate you can get.
Top Looker Studio connectors we love and use on a daily basis (all with free trials): PMA - Windsor - Supermetrics - Catchr - Funnel - Dataslayer. Reviews here and there.
Not sure which one to pick? Have a question? Need a pro to get a project done? Contact us on LinkedIn or by e-mail, and we’ll clear up any doubt you might have.
Looking for Looker Studio courses? We don’t have any… but you can check Udemy!
Creating the Blended Data
First of, please create a new Blend by clicking on Resources -> Manage Blends in the top ribbon:

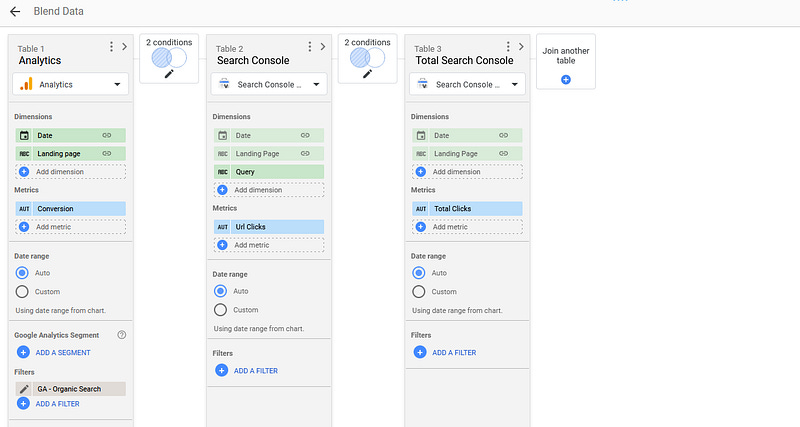
Now click on Add a Blend. We’re going to choose our GA4 property as Table 1, and join it twice to our Search Console data source by clicking twice on Join another table (you can rename them as well, you’ll understand why later). At this stage you should have something like that:

Setting up dimensions and metrics
In Table 1, we are going to add 2 dimensions with some transformation:
Date
A new Dimension that we will call Landing page and that will be as follow: CONCAT(‘https://www.yourwebsite.com',Landing Page). Indeed, Landing pages in Analytics trim the domain, so we need to add it again to match what we’ve got in Search Console. Be careful here, you might need to test a few attempts here as sometimes you’ll have www, sometimes you won’t, … Idea here is that you need to match the Search Console Landing Page with the Analytics Landing page
We are also going to add 1 metric:
Conversion (but could any of your Goal)
And lastly, we are going to create a new filter for your GA4 property, as follow:
Include: Default Channel Grouping Equals to Organic Search

In Table 2, we are going to add 3 dimensions with no transformation:
Date
Landing page
Query
And 1 metric:
Url Clicks
Same in Table 3, but without the Query Dimension, and we are going to rename the Url Clicks metric to Total Clicks.
And you should be seeing this now:
Configuring Join
We are almost there. Please click on Configure join, and as you’d expect, Left outer join Date on Date and Landing page on Landing page.
What are we asking Looker Studio here? Well, for any given day, any landing page, tell me what’s the number of conversions, the total number of clicks and the number of clicks per query.
This is not perfect (you could have Organic Search sessions from outside Google, two keywords could lands on the same page), but it’s our best approximation. If you wanted to be more precise even, you could use another filter, like Source = google and Medium = organic, your call here, please make some tests to see what convinces you.

Ok, so what do we have here? For a given day, a given landing page, this data source will give you:
GA4 conversion
Search Console total number of clicks
Search Console number of clicks by keyword
As mentioned, this is not totally perfect. You won’t get the exact conversion by keyword. If a landing page has 10 conversions, and clicks are split between two queries 60%/40%, well we’ll attribute 6 conversions to the first query and 4 to the second one. But at least we’ve lower down the precision to day / landing page splits, and now total split.
In order to visualize this, please create a new table, put Date and Query as a dimension, and as a Metric enter the following formula: SUM(Clicks) / AVG(Total Clicks) * AVG(Conversion)

And that’s it, for any given keyword / date combination, you’ve got the number of clicks and the conversion associated. And from there, you can now know the associated conversion by keyword !
If you want to use aggregated dates to look at weekly / monthly, instead of joining on Date in the Blended Data, join Year on Year and Month on Month, or Year on Year and Week on Week.
PROBLEM SOLVED !
Top Looker Studio connectors we love and use on a daily basis (all with free trials): PMA - Windsor - Supermetrics - Catchr - Funnel - Dataslayer. Reviews here and there.
Not sure which one to pick? Have a question? Need a pro to get a project done? Contact us on LinkedIn or by e-mail, and we’ll clear up any doubt you might have.
Looking for Looker Studio courses? We don’t have any… but you can check Udemy!
Communicate and browse privately. Check Proton Mail and Proton VPN
Website hosted by Tropical Server