How to set-up Extract Data to make your dashboards faster in Looker Studio?
Frustated by the loading time of your data visualizations in Looker Studio? No worries, here we’ll show you how to set-up Extract Data.
There is nothing more frustating than a tool that takes ages to show data and refresh. Especially in a world where immediacy has become the norm (good or bad, we’ll let you judge here). Anyways, in this short article, we’ll show you how to set-up Extract Data to make your dashboards faster in Looker Studio.
Top Looker Studio connectors we love and use on a daily basis (all with free trials): PMA - Windsor - Supermetrics - Catchr - Funnel - Dataslayer. Reviews here and there.
Not sure which one to pick? Have a question? Need a pro to get a project done? Contact us on LinkedIn or by e-mail, and we’ll clear up any doubt you might have.
Looking for Looker Studio courses? We don’t have any… but you can check Udemy!
Create a source, and then create another Extract Data source
Extract Data is very easy to use and will allow you to decrease dramatically the latency of your reports, but it comes with two main caveats that is important for you to be aware of:
Data only get refreshed on a daily basis at best (you can pick between daily, weekly or monthly). Does the job for most situations, but it’s not a silver bullet if you need almost live data
Like for blended data, you cannot change the date level display in tables and charts (if you’re date field is at a daily level and you choose to render it “Year Month” for instance, it won’t properly group)
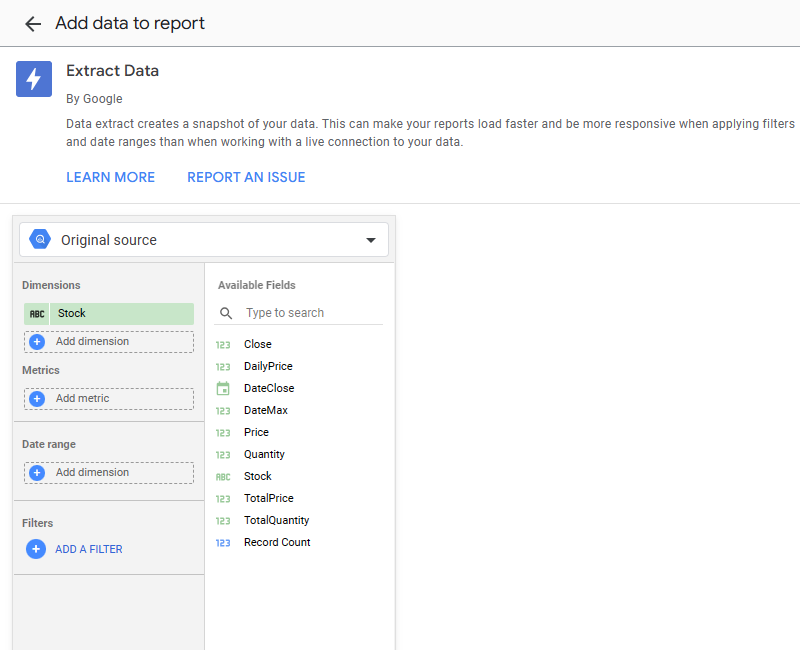
If these aren’t deal-breakers for you, well, let’s get to work! First, you’ll need to have a source set-up in your report. Now, please Add a data source and pick Extract Data from the list of native connectors. You should now see this page, where we will set-up everything:
Pick a source, and from there it is pretty straight-forward:
Drag and drop the dimensions & metrics you’ll be using in your dataviz (quick tip here: if the original source has more fields than necessary, just pick the ones you’ll use, everything has an impact on speed here!)
Select the date field that will be used if applicable
You can also add filters directly to your Extract Data source, so you won’t have to continuously add it to every dataviz that depends on it
Bottom right of your screen, you’ll need to set-up the refresh frequency. you can pick daily, weekly or monthly and set the hour with your time zone
And that’s pretty much it, your Extract Data source is ready to roll, you shouldn’t suffer from latency anymore! And bonus, you can use your Extract Data source to build blended data (but again, if the objective was to make the dashboard faster, please note that blended data negatively impacts performances, so you’ll need to find the right balance here).
In this short article, we’ve reviewed how to set-up Extract to make your dashboards faster in Looker Studio.
PROBLEM SOLVED !
Top Looker Studio connectors we love and use on a daily basis (all with free trials): PMA - Windsor - Supermetrics - Catchr - Funnel - Dataslayer. Reviews here and there.
Not sure which one to pick? Have a question? Need a pro to get a project done? Contact us on LinkedIn or by e-mail, and we’ll clear up any doubt you might have.
Looking for Looker Studio courses? We don’t have any… but you can check Udemy!
Communicate and browse privately. Check Proton Mail and Proton VPN
Website hosted by Tropical Server


Hi, I'm looking for a way to improve loading time for a looker report on Meta ads (single source only) and found your article on Extract Data feature. My data connection is made with Windsor.ai. A rather simple raport with three charts (each with 12 months) and one metric, and it takes ages to load. Could you say a bit more on that: "if you’re date field is at a daily level and you choose to render it Year Month for instance, it won’t properly group" - does it mean that charts with year-month on X axis will not benefit from Extract Data?
Secondly, how does Looker "know" when to use Extract Data (after it is set up), and when to query the original source?