
How to properly use the percentile function in Looker Studio
If you’re working with 3rd party connector or raw data, it’s likely your percentile formules don’t work. No worries, we’ve got a solution!
This is a classic one, but we wanted to talk about it because there is a given use case that could be useful for some of you, in particular when working with 3rd party connectors and/or with raw data. So in this article, we’ll review how to properly use the percentile function in Looker Studio (in case you’ve noticed it doesn’t work for you but can’t understand why).
Top Looker Studio connectors we love and use on a daily basis (all with free trials): PMA - Windsor - Supermetrics - Catchr - Funnel - Dataslayer. Reviews here and there.
Not sure which one to pick? Have a question? Need a pro to get a project done? Contact us on LinkedIn or by e-mail, and we’ll clear up any doubt you might have.
Looking for Looker Studio courses? We don’t have any… but you can check Udemy!
Well, it’s just PERCENTILE(metric,X) and that’s it right?
Indeed ^^ If you want to have the Median or 75% percentile values of a given metric of your dataset for instance, you’ve got this right, create your scorecards, add calculated fields, and copy these formulas:
PERCENTILE(metric,50)
PERCENTILE(metric,75)
So far so good, you can use any value between 1 & 99 and it’ll get you the percentile.
But what if you work with a 3rd party connector like Supermetrics, Windsor or Catchr and you want to work on a calculated field, and at an aggregate level?
For instance, you’re interested in the Top 20% CPA of your ads, or in the Bottom 25% Hook Rate? Straight of the box, the percentile function won’t work because 1/ To get these functions you’ll need to make a formula, and Looker Studio doesn’t like it when mixed when percentiles 2/ You’re probably working with raw data, so how do you tell Looker Studio that you want this percentile to be grouped at Ad level? If you just put your formula, it may return you a number, but it will likely be wrong.
No worries, there is way to do that :)
Create a “fake” blended data to pre-aggregate everything
Here, we’ll try to calculate the Top 20% CPA of our Ads.
In order to do so, we’re going to create a Cross Join blended data, ie recreate a data cube where all data is at the Ad level, with the CPA already calculated (metrics from second table don’t really matter, just make sure not to chime in any dimension):
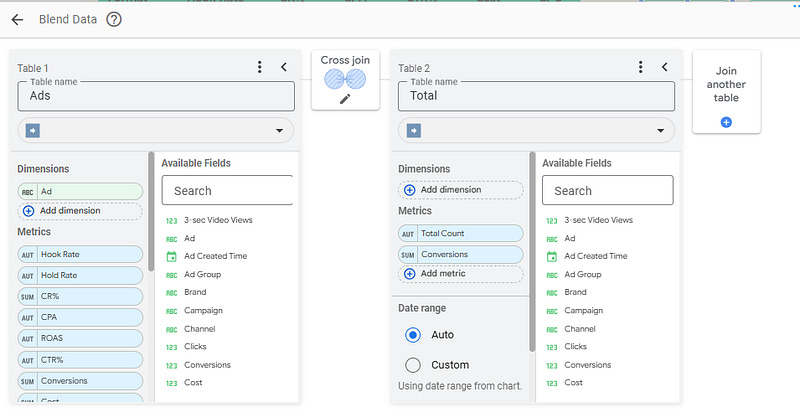
Dates are managed by the date range, and the data cube behind this blend is clean:
All data is at the Ad level (one line = one Ad)
The CPA is already calculated
And from there, to get the Top 20% CPA, we just create a scorecard with the following formula:
PERCENTILE(CPA,20)And we’re good to go!
Now, please replicate and adjust to fit your needs, but remember the main idea: using a cross join blended data to create a flatten data cube at the level you’re interested in, where you’ve already calculated the metric you want the percentile from.
And with that, we’ve shown you how to properly use the percentile function in Looker Studio.
PROBLEM SOLVED
Top Looker Studio connectors we love and use on a daily basis (all with free trials): PMA - Windsor - Supermetrics - Catchr - Funnel - Dataslayer. Reviews here and there.
Not sure which one to pick? Have a question? Need a pro to get a project done? Contact us on LinkedIn or by e-mail, and we’ll clear up any doubt you might have.
Looking for Looker Studio courses? We don’t have any… but you can check Udemy!
Communicate and browse privately. Check Proton Mail and Proton VPN
Website hosted by Tropical Server