
How to monitor website performances in Looker Studio with foo.software?
Monitor your website performances in Looker Studio, act accordingly and improve your SEO ranking !
In case you were wondering, yes, your website performances are very important, and this for two main reasons. First, you want to provide the best possible user experience to your visitors. Second, these will impact your SEO, as bad performance websites get downranked in results. So you better monitor them and take action any time you’re seeing something a bit kinky.
In this article, we’ll quickly review the tool we’ll be using, the metrics we’ll be tracking and how we can smoothly set up a Looker Studio to monitor these.
Top Looker Studio connectors we love and use on a daily basis (all with free trials): PMA - Windsor - Supermetrics - Catchr - Funnel - Dataslayer. Reviews here and there.
Not sure which one to pick? Have a question? Need a pro to get a project done? Contact us on LinkedIn or by e-mail, and we’ll clear up any doubt you might have.
Looking for Looker Studio courses? We don’t have any… but you can check Udemy!
What is foo.software?
Basically, this is a very nice tool that provides a connector to retrieve website performances metrics directly into Looker Studio, so you can know where you’re at and monitor over time to take actions when necessary. They’ve got a free plan (which we will use for the demo here), but also a paid plan if you want to keep a track record of your performances.
In their own words:

What website performances metrics will we track?
Lighthouse (a Google tool) provides a set of 4 metrics (performances, accessibility, best practices & SEO) for desktop & mobile, measured in a “test environment” (always the same CPU, always the same internet speed connection, …), so it makes comparison across websites and monitoring over time more stable.
These metrics are self-explanatory I believe, and if any is out of whack, you’ll be prompted with a clear description of what is happening so you’ll know where to focus your efforts, nothing to worry here, we’ll be holding your hand.

Setting up the website performances Looker Studio dashboard
First, please proceed to foo.software and sign up. So far you can stay on the free plan, which provides enough access for the demo.
Proceed to pages, add a page, and enter the URL of your website:

Now, enter in your page by clicking on it, and copy the pageId code you’ll see in the URL or on the page (this will be our key for the foo connector in Looker Studio).
We can now go back to Looker Studio, and proceed as follow: Add a new report, Add data, search for foo in the connectors list, select Lighthouse by foo. As per the parameter, copy your pageId and select Mobile: we’ve set up our first website performances data source!

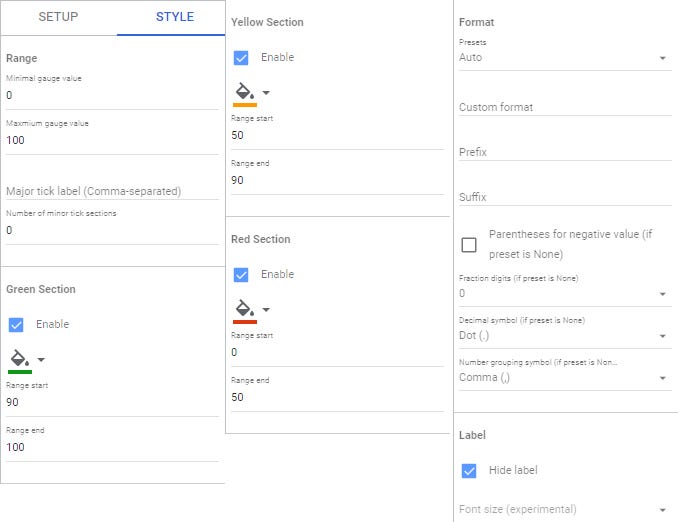
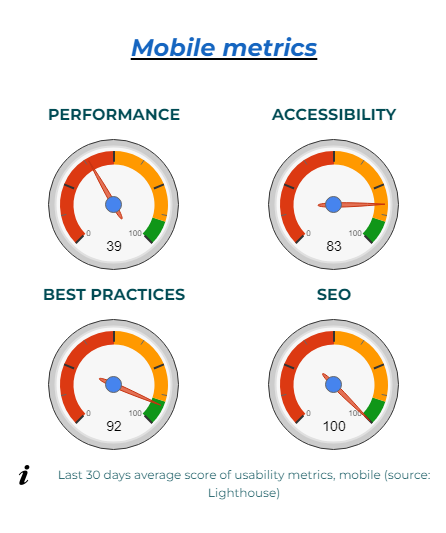
We’ll now create a new Gauge by Google. We’ll choose PERFORMANCE (AVG) as the metric, rename it to Performance, set the Default Date Range choosing last 30 days (including today), and doing a bit of Styling as follow:
Please repeat with ACCESSIBILITY (AVG), BEST PRACTICES (AVG) & SEO (AVG), and that’s it, you’re tracking your website performances. If you want to track them over time, you can also create a line chart, using Date as a dimension, and using the same metrics but without the AVG.
This is nice, but it’s not telling us how we could improve. No worries, the tool also provides feedback to tell us where we should focus our effort.
Please create a new table (don’t forget to set up the date range control to include Today), and set-it up as follow, adding an extra dimension called link, using this formula:
HYPERLINK(REGEXP_EXTRACT(Opportunity Description, “href=\”+([^\” ]*)”),”link”)

And that’s it! The table you’re seeing is telling you what are your issue, how long they’re delaying the page speed, and by clicking on the link, you’ll get insights on what you should do to improve your website, provide a better user experience and improve your ranking!
Now, we’ve done this for mobile. If you wanted to set up the same for desktop, re-create a new data source with the same pageId, but this time selecting desktop, and replicate everything we’ve done so far.

In this article, we’ve reviewed how to set-up a Looker Studio to track & monitor your website performances. This is just the emerged part of the iceberg. Every time you see something orange or red, well, you’ll need to take actions. But at least, you’ll get a good hint on what and where :)
PROBLEM SOLVED !
Top Looker Studio connectors we love and use on a daily basis (all with free trials): PMA - Windsor - Supermetrics - Catchr - Funnel - Dataslayer. Reviews here and there.
Not sure which one to pick? Have a question? Need a pro to get a project done? Contact us on LinkedIn or by e-mail, and we’ll clear up any doubt you might have.
Looking for Looker Studio courses? We don’t have any… but you can check Udemy!
Communicate and browse privately. Check Proton Mail and Proton VPN
Website hosted by Tropical Server