
How to connect a Google Sheets to Looker Studio and make great data visualizations?
You've got a table on a Google Sheets and want to take advantage of Looker Studio to make the data speak for itself? Let's see how you can do that!
Shall it be the results of a Google forms, your company performances or a personal project tracking file, Google Sheets tends to marry very well with Looker Studio reports when it comes to producing nice data visualizations, sharing them and generating insights. This is why, in this article, we’ll show you how to connect a Google Sheets to Looker Studio and make great data visualizations (and so, avoiding pitfalls and common issues).

Top Looker Studio connectors we love and use on a daily basis (all with free trials): PMA - Windsor - Supermetrics - Catchr - Funnel - Dataslayer. Reviews here and there.
Not sure which one to pick? Have a question? Need a pro to get a project done? Contact us on LinkedIn or by e-mail, and we’ll clear up any doubt you might have.
Looking for Looker Studio courses? We don’t have any… but you can check Udemy!
First, let’s make quick sanity checks
There are a few requirements if you want to import correctly a Google Sheets tab into Looker Studio, mainly:
Headers on line 1 (expected)
Names of these headers to be unique (Looker Studio doesn’t like repetition)
A non-empty line 2 (drives more issues than you may think)
In each column, data should have a set format: Date column in date formats, Number column in number formats, … if not, again, tends to drive problems you won’t understand as error code in Looker Studio are not always self-explanatory
Once you’ve got your data ready, let’s move on and create your first report in Looker Studio.
Create your report, import your data, and start playing
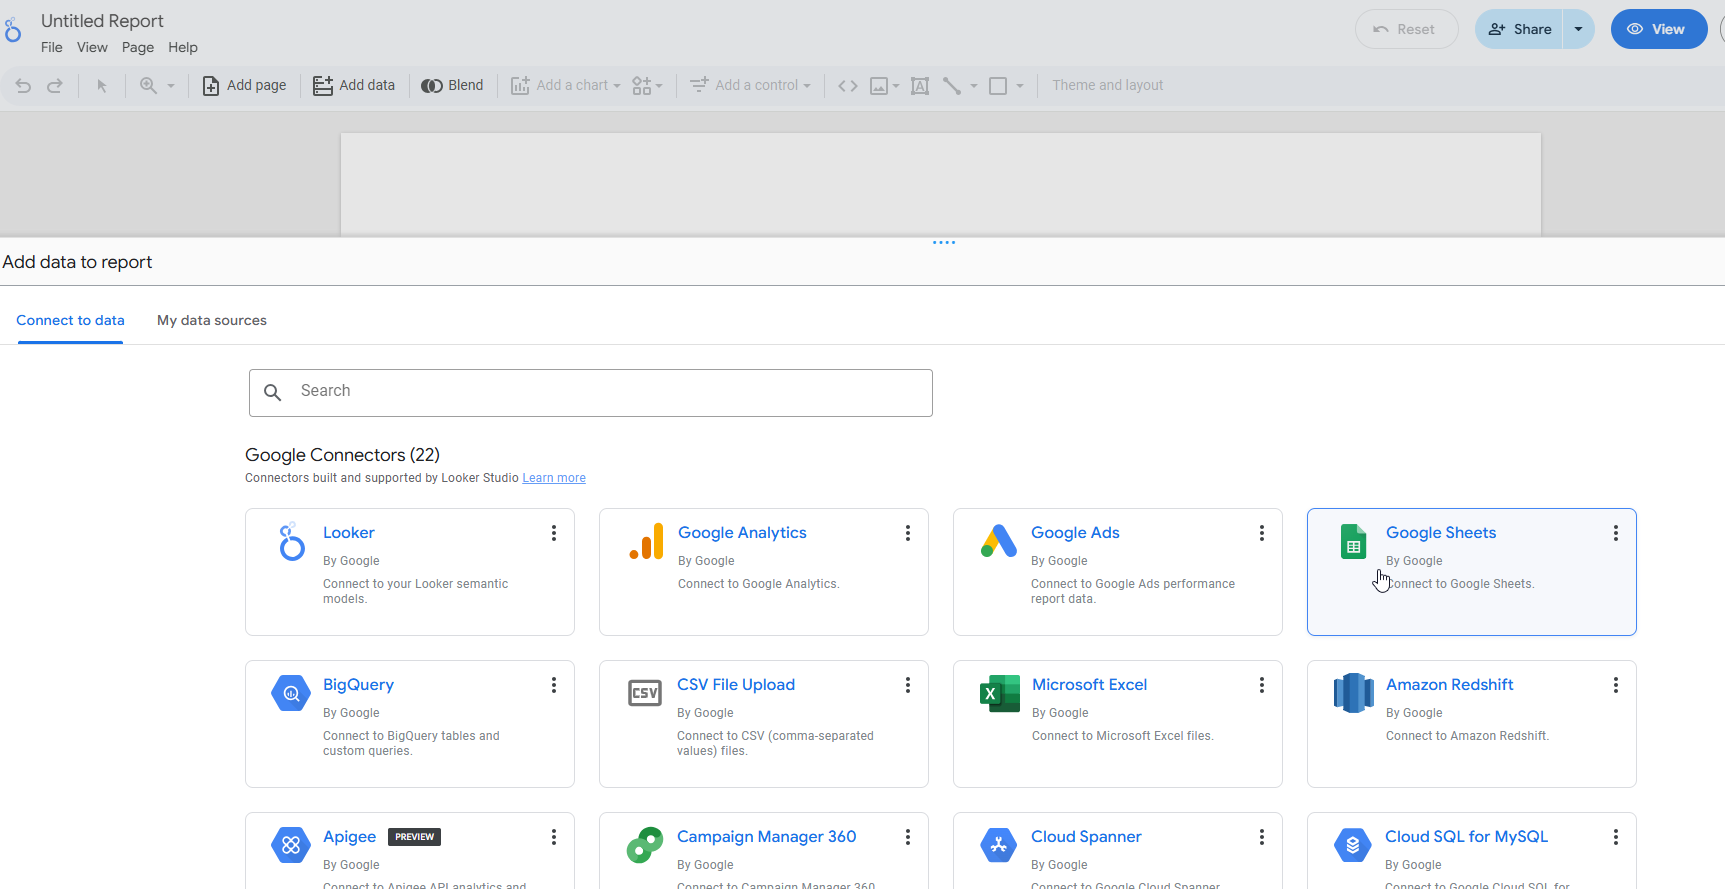
Let’s proceed to https://lookerstudio.google.com, and create a blank report. A pop-up page will invit you to add a new data source. Select Google Sheet, choose the file you’re interested in, and select the tab. You can import everything, or limitate to a specific range (A1:C456, A:D, …, especially useful if you’re the kind of person that tends to leave trash calculations on cells on the right columns):
And you’re almost done!
First, Looker Studio will ask you if you want to use a freeform layout or a responsive layout. Once you’ve made your choice, it’s quite easy:
Add charts using the top ribbon: tables, scorecards, bar chart, pie chart… really depends on what you want to show
Edit them by picking up date ranges, dimensions, metrics. You can even make dynamic calculations. Last but not least, edit their Style using the right ribbon so the touch and feel matches your company colors for instance
Add a few controls (date controls, category controls), so you can filter all your dataviz by clicking on a button
Ok, what’s next?
Well, that’s up to you now! We’ve got plenty of articles and tutorials for you here at https://lookerstudiobible.com to help you build the dashboard of your dreams. And if something is not working or if you need help, don’t be shy and contact us, we might have a solution to your problem.
In this article, we’ve shown you how to connect a Google Sheets to Looker Studio and make great data visualizations.
PROBLEM SOLVED
Top Looker Studio connectors we love and use on a daily basis (all with free trials): PMA - Windsor - Supermetrics - Catchr - Funnel - Dataslayer. Reviews here and there.
Not sure which one to pick? Have a question? Need a pro to get a project done? Contact us on LinkedIn or by e-mail, and we’ll clear up any doubt you might have.
Looking for Looker Studio courses? We don’t have any… but you can check Udemy!
Communicate and browse privately. Check Proton Mail and Proton VPN
Website hosted by Tropical Server