
How to calculate median, percentile, average with third-party connectors in Looker Studio
Average, median and percentile are not working for you in Looker Studio? No worries, we’ve got solution for you so they’ll work like a…
Working with third-party connectors can sometimes be difficult. Indeed, data is not aggregated yet, it’s raw data available at date X campaign X ad X device X … level. This is very convenient when you want to run deep analysis. A bit less when you want to calculate meaningful metrics such as median, percentile and such. Therefore, in this article, we’ll show you how to properly calculate median, percentile, average and more with third party connectors in Looker Studio.
Top Looker Studio connectors we love and use on a daily basis (all with free trials): PMA - Windsor - Supermetrics - Catchr - Funnel - Dataslayer. Reviews here and there.
Not sure which one to pick? Have a question? Need a pro to get a project done? Contact us on LinkedIn or by e-mail, and we’ll clear up any doubt you might have.
Looking for Looker Studio courses? We don’t have any… but you can check Udemy!
First, let’s understand the issue
As mentionned in the introduction, third-party connectors tend to provide raw data that is then aggregated in Looker Studio. Thing is, it makes some calculations impossible. Here’s a quick example. We’ve ran 22 ads for a Total Spend of 35k€. If you use the Spend metric and use the Average function, it won’t work. There is a workaround, by creating the following formula:
SUM(Cost)
/
COUNT_DISTINCT(Ad)
Does work here (thanks Lord), but what about the Median, or Percentile? In Looker Studio mind, there is only one Ad that is summed, and hence it won’t be able to properly calculate Median nor Percentiles as seen below, always returns total. But good news, we’ve got a workaround for you:

Create a fake blended data to re-aggregate by Ads
Here, we’ll create a blended data to re-aggregate by Ads. So now, in our new data source, one line = one Ad. This way, Looker Studio will understand when we ask it to calculate median and percentiles.
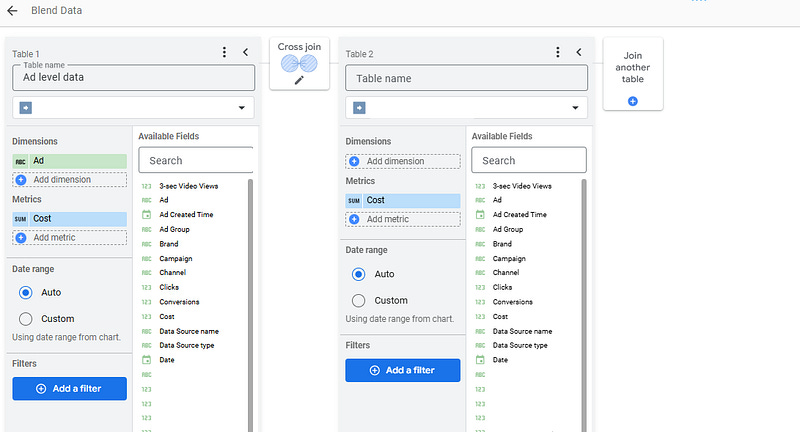
To do so, add a new Blended data; first, add your data source with the level you’re interested in as a dimension (in our case, we want data at Ad level). Then, Cross join to the same data source, but only put a dummy metric, NO DIMENSION. Here we pust Costs, but you could just put 1, we won’t use it. Also, don’t add date in dimensions, stick to the Auto Date Range:
And that’s it! In your KPIs, replace with your newly created Blended data source, display your metric and choose Average or Median as aggregate: it works!
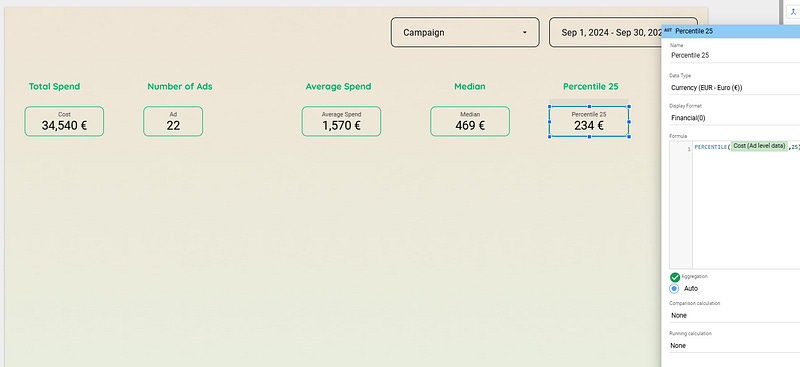
As per the percentile, just use the function, and it will work smoothly.
PERCENTILE(Cost,25)In this quick article, we’ve reviewed how to properly calculate median, percentile, average and more with third-party connectors in Looker Studio.
PROBLEM SOLVED
Top Looker Studio connectors we love and use on a daily basis (all with free trials): PMA - Windsor - Supermetrics - Catchr - Funnel - Dataslayer. Reviews here and there.
Not sure which one to pick? Have a question? Need a pro to get a project done? Contact us on LinkedIn or by e-mail, and we’ll clear up any doubt you might have.
Looking for Looker Studio courses? We don’t have any… but you can check Udemy!
Communicate and browse privately. Check Proton Mail and Proton VPN
Website hosted by Tropical Server