How to build a stocks portfolio tracker in Looker Studio using Google Sheets, Google Finance and…
Want to build your own stocks portfolio tracker using Sheets, Google Finance, Big Query and Looker Studio? In this article we’ll show you…
A hell of a program right?! In this article, we’ll review how to build a stocks portfolio tracker in Looker Studio (also known as Data Studio) using Google Sheets, Google Finance and Google Big Query.
This is a “food for thought” article. We don’t expect you to actually build a stocks portfolio tracker, but more so to get at ease with the following concepts:
How to populate Google Sheets using built-in functions
How to send Google Sheets data to Google Big Query seamlessly
How to send this data back to Looker Studio after having done some calculations
Knowing how to manoeuvre these in conjunction can lead to very powerful dashboards, without having to write that much code!
Top Looker Studio connectors we love and use on a daily basis (all with free trials): PMA - Windsor - Supermetrics - Catchr - Funnel - Dataslayer. Reviews here and there.
Not sure which one to pick? Have a question? Need a pro to get a project done? Contact us on LinkedIn or by e-mail, and we’ll clear up any doubt you might have.
Looking for Looker Studio courses? We don’t have any… but you can check Udemy!
Get stocks data into Google Sheet
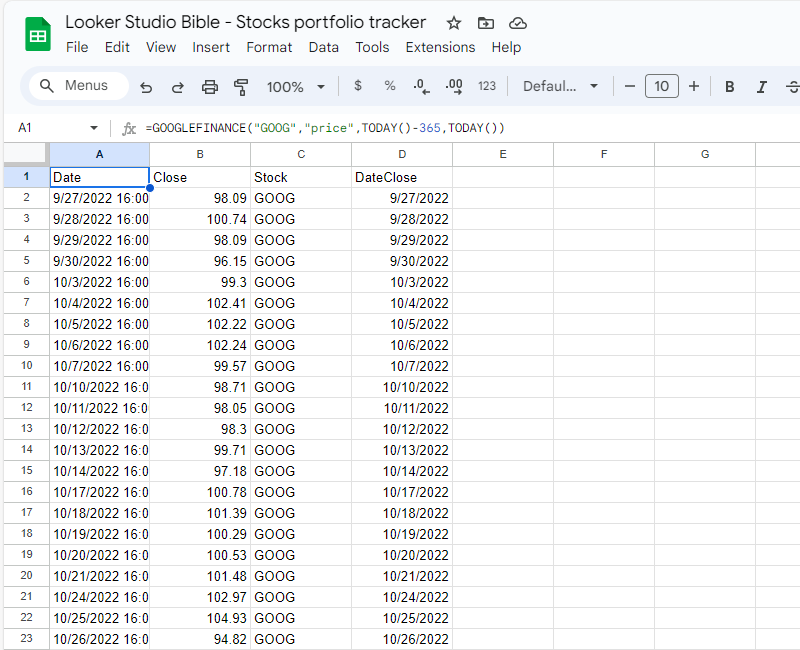
First, we’ll use the Google Finance built-in function to get the stock value from the last 365 days. As easy as that, we’ll ask it to give the closure price for a couple of stocks, Google and Apple.
Please proceed to your Google Drive, create a new blank spreadsheet, and in a first tab called GOOG, please insert the following function:
=GOOGLEFINANCE(“GOOG”,”price”,TODAY()-365,TODAY())
On top of that, in column C, we’ll add the stock name (column name: Stock and column value: GOOG) and a DateClose in date format (the Google Finance function gives use a datetime, not ideal at this stage really), using the following function:
=IFERROR(TO_DATE(DATEVALUE (A2)),””)
You should get something like that:
Please repeat the operation on a second tab called AAPL, only replacing GOOG with AAPL to get the Apple stock prices.
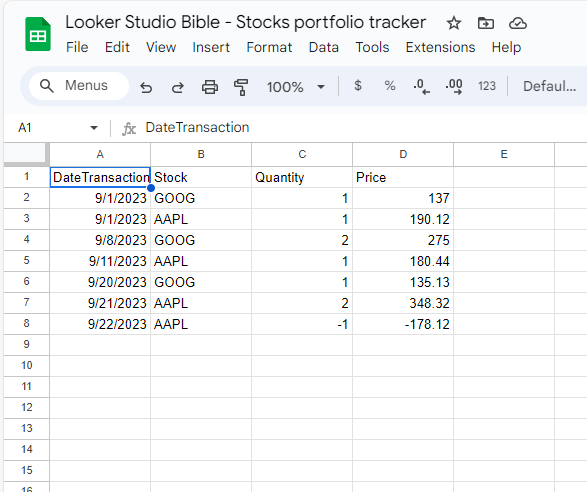
Now, let’s create a third tab called Transactions, in which we’ll list all the operations (both buy & sell) with the date, the stock, the quantity (negative if sell) and the total price of the transactions (again, negative if sell).
This is our sample data:
At this stage, our job in Google Sheets is finished. All you will have to do to maintain it is to add new tabs as you buy/sell more stocks, and put all your transactions in the Transactions tab so you can keep track of everything.
Let’s move on now to Big Query. You’ll need to have some basic knowledge to be able to follow the next steps, but it’s no rocket science either, we’re pretty sure you’ll be able to sort it out!
Get your Google Sheets tabs in Big Query tables, and start processing data
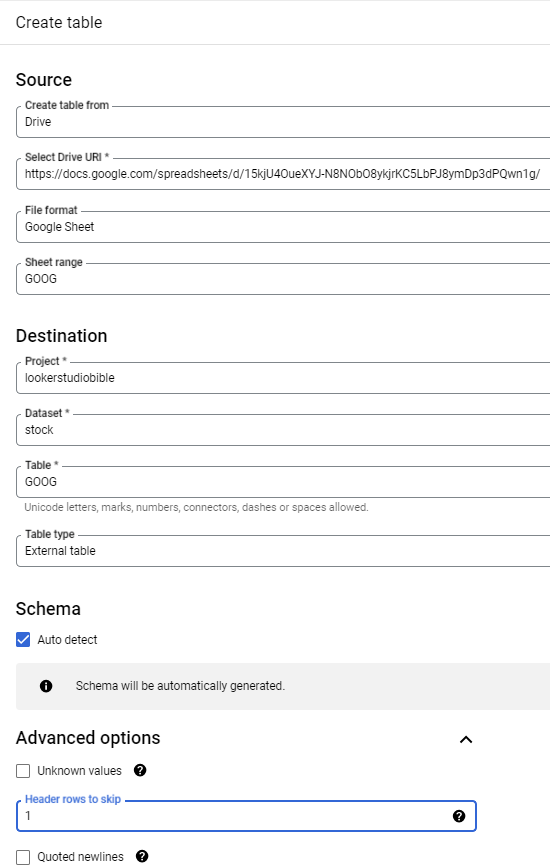
At this stage you need to have a project with a dataset. Click on the 3 dots at the right of your dataset name, and pick Create table. First, we’ll get the GOOG data, but the process is exactly the same for every tab.
We’ll set up the table creation as follow:
Create table: from Drive
Select Drive URI: copy the path of your spreadsheet
File format: Google Sheet
Sheet range: the name of your tab
Destination: your Project, Dataset, and the name of the Table (we’ll reuse GOOG here)
Table type: External table
Schema: Auto detect
Advanced Options menu / Header rows to skip = 1
And that’s it, you’ve just created your first Google Big Query table, replicating live data from a Google Sheets tab! A few comments here:
Make sure column names are unique
Make sure column values are always in the same format (if column A has date in, well, make sure it’s only date)
Once the table is created in Big Query, it’ll always replicate what you’ve got in Google Sheets, but please don’t play neither with format, column names and/or order. You can add/remove data, you cannot change the schema
This is what it looks like here:
Now, repeat the operation to get an AAPL table and a Transactions table. All 3 tabs are now in Google Big Query, we’re almost there, hurray!
Getting into SQL coding
For the next step you might need some SQL knowledge. But again, the objective here is to show you things you can do with the GCP, maybe you’re happy with just joining two tables in Big Query because it’s easier to do than in Sheets or Looker Studio (damn blended data…), no need to complexify too much.
For our purpose, we’ve wrote the following piece of code that basically gives you, for each date / stock: the price of the stock (from 2023/09/01), the quantity in the portfolio, the money invested in the portfolio and the actual price of the portfolio. We’ve added a flag DateMax, ie the last day of quotation available, to be used later on in Looker Studio.
You can just copy and paste this code, ajust where necessary (in particular changing your project and dataset names), and save results as a new table you’ll call portfolio:
WITH table_stocks AS ( SELECT DateClose , Close , Stock FROM `lookerstudiobible.stock.Goog` WHERE DateClose IS NOT NULL AND DateClose >= ‘2023–09–01’ UNION ALL SELECT DateClose , Close , Stock FROM `lookerstudiobible.stock.Aapl` WHERE DateClose IS NOT NULL AND DateClose >= ‘2023–09–01’ ) , table_stocks_orders AS ( SELECT ts.* , t.Quantity , t.Price , SUM(t.Quantity) OVER (PARTITION BY ts.Stock ORDER BY ts.DateClose) AS TotalQuantity , SUM(t.Price) OVER (PARTITION BY ts.Stock ORDER BY ts.DateClose) AS TotalPrice , SUM(t.Quantity) OVER (PARTITION BY ts.Stock ORDER BY ts.DateClose) * ts.Close AS DailyPrice FROM table_stocks ts LEFT JOIN `lookerstudiobible.stock.Transactions` t ON ts.Stock = t.Stock AND ts.DateClose = t.DateTransaction ) , date_max AS ( SELECT MAX(DateClose) AS DateMax FROM table_stocks_orders ) SELECT tso.* , CASE WHEN dm.DateMax IS NULL THEN 0 ELSE 1 END AS DateMax FROM table_stocks_orders tso LEFT JOIN date_max dm ON tso.DateClose = dm.DateMax
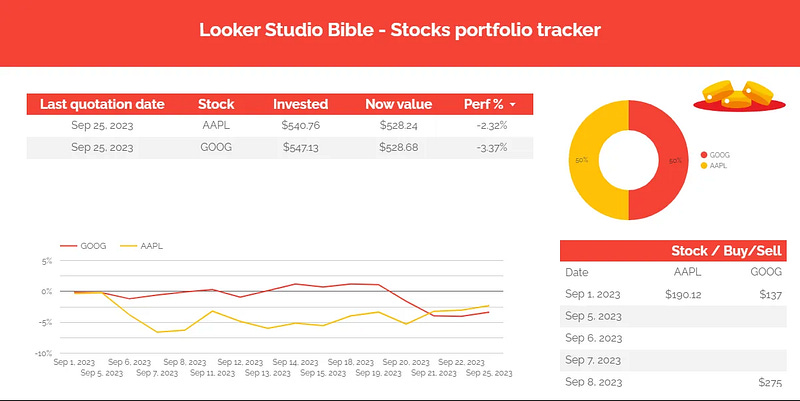
We’re almost there! Now, you can go to Looker Studio, Create a new report, add a BigQuery data source pointing to this newly created table called portfolio, and you’re good to play, what you do next with this data is under your control, sky is the limit :)
A few comments on the formula used:
Invested = TotalPrice
Now Value =DailyPrice
Set a new filter with Date Max = 1 when you want to see the latest screenshot
Perf % = SUM (DailyPrice) / SUM (TotalPrice) — 1
In this how-to article, we’ve reviewed how to build a stocks portfolio tracker in Looker Studio, using Google Sheets, Google Finance and Google Big Query.
PROBLEM SOLVED !
Top Looker Studio connectors we love and use on a daily basis (all with free trials): PMA - Windsor - Supermetrics - Catchr - Funnel - Dataslayer. Reviews here and there.
Not sure which one to pick? Have a question? Need a pro to get a project done? Contact us on LinkedIn or by e-mail, and we’ll clear up any doubt you might have.
Looking for Looker Studio courses? We don’t have any… but you can check Udemy!
Communicate and browse privately. Check Proton Mail and Proton VPN
Website hosted by Tropical Server


