
How to build a Shopify + Google Ads + Meta Ads (and more) marketing report with Funnel.io
Need to build a Shopify + Google Ads + Meta Ads e-commerce report in Looker Studio, but unsure how to set it up? Here we’ll show you how
Funnel is one of our favorite connectors to work with (along with Supermetrics, Windsor, Catchr or PMA, all great solutions). The main reasons? Their interface to create fields is dope, the possibility to pre-blend data before sending it to Looker Studio is great, and the ease to add and manage a large number of data sources is awesome. So in this article, we’ll show you how to build a Shopify + Google Ads + Meta Ads (and more) marketing report with Funnel.io in Looker Studio, step by step. You’re welcome!
Top Looker Studio connectors we love and use on a daily basis (all with free trials): PMA - Windsor - Supermetrics - Catchr - Funnel - Dataslayer. Reviews here and there.
Not sure which one to pick? Have a question? Need a pro to get a project done? Contact us on LinkedIn or by e-mail, and we’ll clear up any doubt you might have.
Looking for Looker Studio courses? We don’t have any… but you can check Udemy!
Open an account and connect data sources
Good news, Funnel offers a free trial so you can try it out and check if this is the connector for you. First, proceed to their website and open an account with your Google account or e-mail address.
Once done, we’ll be adding our 3 data sources. On the left ribbon, proceed to Connect, and then top right, + Connect Data Source:
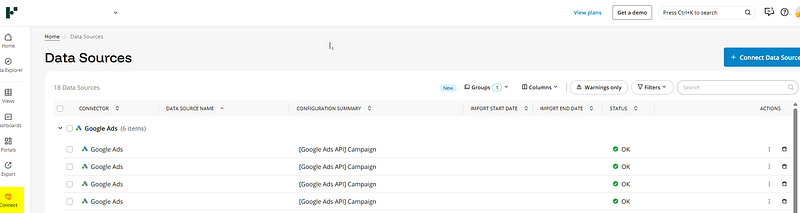
Select the data source, connect your account, and eventually pick the type of data you’re interested in. For Shopify, we’ll take the Sales transaction. For Google Ads & Meta Ads, we’ll stick to Campaign level, but if you wanted, you could go down to Ads level and/or add loads of Optional Dimensions such as Device, Video info, …
Please note that if you wanted different types of information for the same account, you might have to connect several times to retrieve all as Funnel cannot always get everything at once.
At this stage, just a few clicks in, your data is already there, ready to be treated, so let’s move to the next step, data mapping!
Map dimensions and metrics
Now, go to Organize / Dimensions on the left ribbon, and you should see some dimensions that are pre-created:

If you click to open Campaign for instance, you’ll see that it’s a dimension that already blends Shopify, Google Ads & Meta Ads data, and it shows you how it does it, by mapping on the Campaign field for all data source available.
This is a pre-created dimension, but if you wanted to created a new one, you’d just have to click top right on + Create Dimension, and specify your rules. They can be applied to all data sources / accounts, or it can be source / account specific, really depends on you.
Moving to Organize / Metrics, same goes here. You’ve got a few metrics pre-created such as Cost, Impressions and Clicks, but feel free to add yours.
Once you’ve created your dimensions and metrics, we’ll now create a data share, ie the cube of data that will be sent to Looker Studio.
Create a data share to filter on accounts, dimensions and metrics you’re really interested in
If you’ve already worked with connectors, you’ve already noticed that some of them have hundreds of fields, not always easy to navigate. Here, we’ll create our own connector ie pick the dimensions and metrics we really want.
Bonus, here we can also decide to filter out some accounts, so our data doesn’t get mixed.
Proceed to Export, and then top right + Create Export. Pick Looker Studio, give it a name, and from there:
Choose fields: no need to add them all, keep the one by default and add the Custom fields you’ve just created
Dimension filter: maybe you want to filter out some data, this is where it all happens, by including/excluding Data Sources
If you’re playing with Monetary fields, pick your currency. Please note that Funnel allows you to convert, and either use their exchange rate table or create your own (this would be under Organize / Currencies)
And you’re good to go
Last but not least, add your data source to Looker Studio and start building the dashboard of your dreams
This is the final part. Create a new report in Looker Studio, connect a data source, pick Funnel, select the data share you’ve just created, and ta-dam, all (and only) the dimensions and metrics you’ve choosen are there, ready to be picked by you and used wisely.
From there, you can build amazing dataviz to mix Shopify, Google & Meta data and monitor the performance of your business, without having to worry about data blending or finding the right field in Looker Studio.
In this article, we’ve reviewed how to build a Shopify + Google Ads + Meta Ads (and more) marketing report with Funnel.io in Looker Studio, step by step.
PROBLEM SOLVED
Top Looker Studio connectors we love and use on a daily basis (all with free trials): PMA - Windsor - Supermetrics - Catchr - Funnel - Dataslayer. Reviews here and there.
Not sure which one to pick? Have a question? Need a pro to get a project done? Contact us on LinkedIn or by e-mail, and we’ll clear up any doubt you might have.
Looking for Looker Studio courses? We don’t have any… but you can check Udemy!
Communicate and browse privately. Check Proton Mail and Proton VPN
Website hosted by Tropical Server