How to build a pivot table in Looker Studio?
Ever wondered how to build a pivot table in Looker Studio, but were too afraid to ask? We’ve got good news for you, here we’ll show how to!
Ever wondered how to build a pivot table in Looker Studio, but were too afraid to ask? We’ve got good news for you, in this article we’ll show how to, step by step. Not that complicated once you understand the few concepts explained below. Hope you’ll enjoy!
Top Looker Studio connectors we love and use on a daily basis (all with free trials): PMA - Windsor - Supermetrics - Catchr - Funnel - Dataslayer. Reviews here and there.
Not sure which one to pick? Have a question? Need a pro to get a project done? Contact us on LinkedIn or by e-mail, and we’ll clear up any doubt you might have.
Looking for Looker Studio courses? We don’t have any… but you can check Udemy!
First thing first, let’s make amends…
Ok, we did write this article.
This was a long time ago, things have changed since then. Still not totally ideal according to us, but all least Google did a great job when it comes to formatting and loading times, so we must acknowledge their efforts!!
It’s all about not overloading your dataviz!
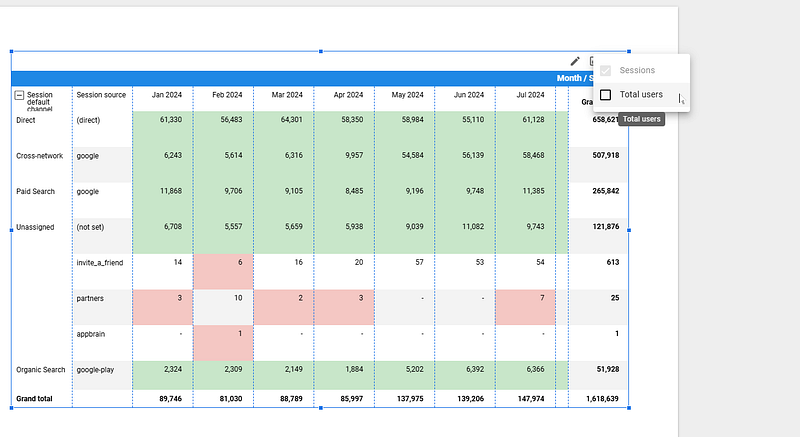
Let’s Add a chart, choose pivot table, and choose your data source. Pretty straight-forward. From there, try to limit to a couple of lines maximum, and one column, or one line and a couple of columns maximum. If not, it gets hard to read quite fast.
And remember to enable Expand-Collapse. It does help a lot with the reading.
Now, please please please, only select one metric, and if you need to show more / offer some flexibility to your users, add Optional metrics. This way, they can decide what to choose (you need to Always show Chart header, last option in the Setup ribbon).
Now, if you really need to, add subtotals, but we’d rather stick with grand totals only.
A bit of formatting, and you’re good to go
A good thing when building big pivot tables is to set some conditional formatting so you get the insights quickly. Play with your colors, Wrap text for columns and lines if necessary. Also, use different colors for Odd & Even rows, and we start having something decent!
And that was it for this short article! Yes, you can use Pivot table. Try to do it wisely, remember to change your date format to Year Month to make the reading easier, try to use formulas so everything works when you expand-collapse, try to conditionnal format to ease the reading, and you should be good to go :)
PROBLEM SOLVED
Top Looker Studio connectors we love and use on a daily basis (all with free trials): PMA - Windsor - Supermetrics - Catchr - Funnel - Dataslayer. Reviews here and there.
Not sure which one to pick? Have a question? Need a pro to get a project done? Contact us on LinkedIn or by e-mail, and we’ll clear up any doubt you might have.
Looking for Looker Studio courses? We don’t have any… but you can check Udemy!
Communicate and browse privately. Check Proton Mail and Proton VPN
Website hosted by Tropical Server

