How to build a field using a CASE WHEN statement in Looker Studio?
Feeling like your Looker Studio dataset doesn’t give you exactly what you want? Build your own metrics & dimensions using CASE WHEN !
Maybe that you are a very proficient professional in Looker Studio, but you haven’t developped any skill in SQL (yet). Why bother, given the fact that Looker Studio is so intuitive and so user-friendly?
Well, you might want to reconsider this as SQL is the new Excel (or is it Looker Studio?), and can save your ass in many occasions. In this article, I’ll show you how to build a field using a CASE WHEN statement in Looker Studio.
It’s a very interesting feature when your dataset doesn’t give you exactly what you want, and so you need to build your own metrics & dimensions.
But in reality, this article is a SQL introduction for people who haven’t had the time to learn it yet, to give you eager to study it. You can unlock many features by knowing its syntax, so please do it!
Top Looker Studio connectors we love and use on a daily basis (all with free trials): PMA - Windsor - Supermetrics - Catchr - Funnel - Dataslayer. Reviews here and there.
Not sure which one to pick? Have a question? Need a pro to get a project done? Contact us on LinkedIn or by e-mail, and we’ll clear up any doubt you might have.
Looking for Looker Studio courses? We don’t have any… but you can check Udemy!
CASE WHEN syntax
Basically, CASE WHEN statement in SQL/Looker Studio is the equivalent of the IF (THEN) statement in Excel. Its syntax is very easy. Starts with a single CASE, then all WHEN THEN one after the other. Maybe a ELSE if you want to have a condition when no condition is met (not compulsory, but then if no condition is met, you’ll get a NULL), and then close it with a single END.
CASE
WHEN … THEN ….
WHEN … THEN ….
WHEN … THEN ….
ELSE …
END
As easy as that! In Looker Studio, it can be applied to either metrics or dimensions (which makes it super powerful), you can include operations and REGEX, but beware, Looker Studio doesn’t like when you mix metrics & dimensions in the same formula (we’ll come back to this point later).
CASE WHEN operators
Very classic here:
Matches: WHEN Country=”Spain” THEN …
Doesn’t match: WHEN Country <>”Spain” THEN …
In list: WHEN Country IN (“Spain”,”United Stated”) THEN …
Not in list: WHEN Country NOT IN (“Spain”,”United Stated”) THEN …
Mathematical operators: WHEN Sessions > 20 THEN …
You can go one step beyond using formulas or mixing conditions:
Contains: WHEN CONTAINS_TEXT( Country,”Spain”) THEN …
Accepts AND/OR: WHEN Country=”Spain” AND Device=”Mobile” THEN …
You can even embed them to have multi-level conditions. Possibilites are endless!
CASE WHEN as a new dimension
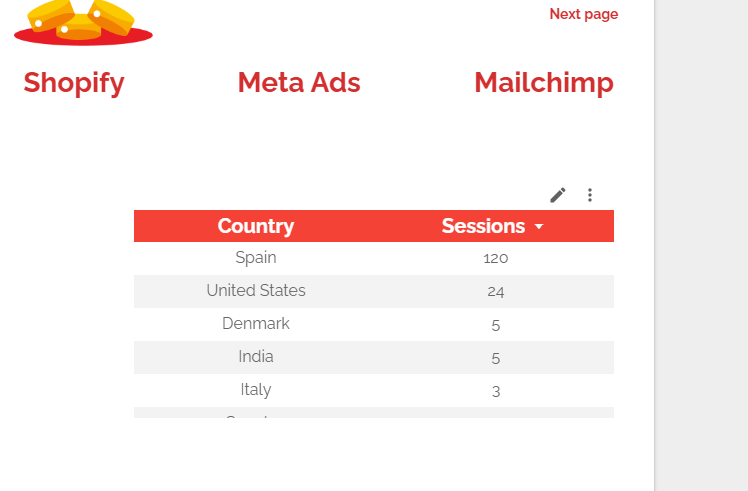
Now, let’s say you’ve got a table that gives you sessions by country from a GA4 property, like this one:
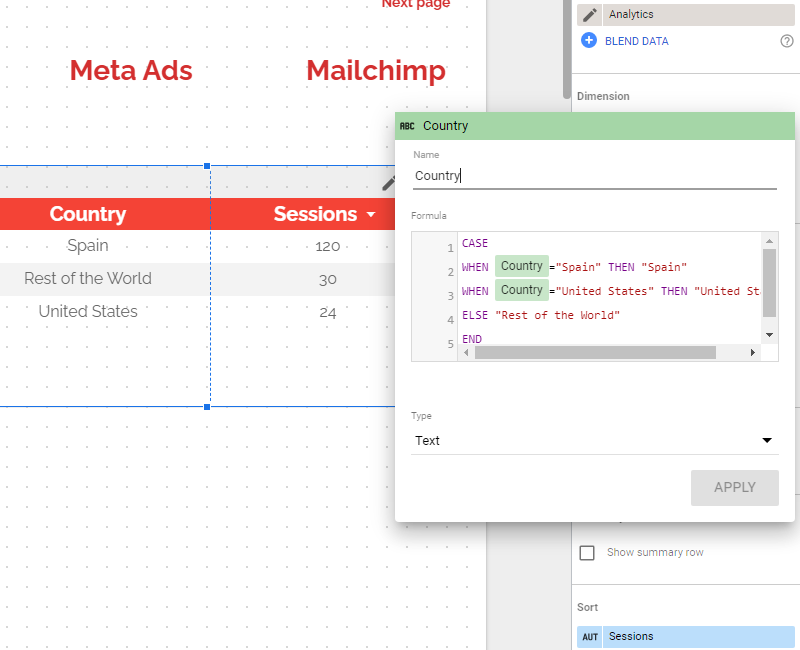
F*cking long tail, impossible to read, so I want to group all small countries together (small in terms of sessions, obviously). In order to do so, I’ll create a new dimension to replace the current Country one, Add field,and input the following formula:
CASE WHEN Country=”Spain” THEN “Spain” WHEN Country=”United States” THEN “United States” ELSE “Rest of the World” END
That’s it, I’ve built a new dimension using a CASE WHEN statement. Cool right? As mentioned, sky is the limit, it really depends on what you want to achieve, but in most cases this statement will help you ease the reading of your tables, charts, pivot tables, …
CASE WHEN as a new metric
It starts getting interesting. What about if we wanted to play with CASE WHEN on metrics?! We can as well.
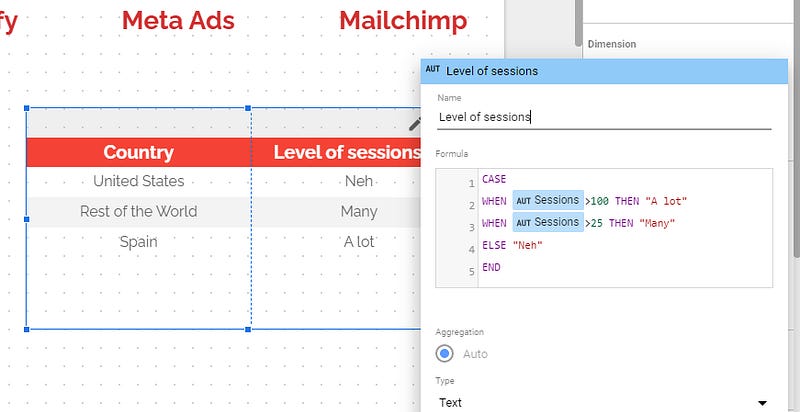
Be careful here, the default aggregation is going to be key. If you write a condition like WHEN sessions>100, and that the default aggregation is sum, well condition will apply when SUM(sessions)>100 in reality. But if default aggregation was average, then your condition would be AVG(sessions)>100, not the same right?
Here, I know that Analytics provides sum as default aggregation, so I can go without fear and create a new metric as follow:
CASE
WHEN Sessions>100 THEN “A lot”
WHEN Sessions>25 THEN “Many”
ELSE “Neh”
END
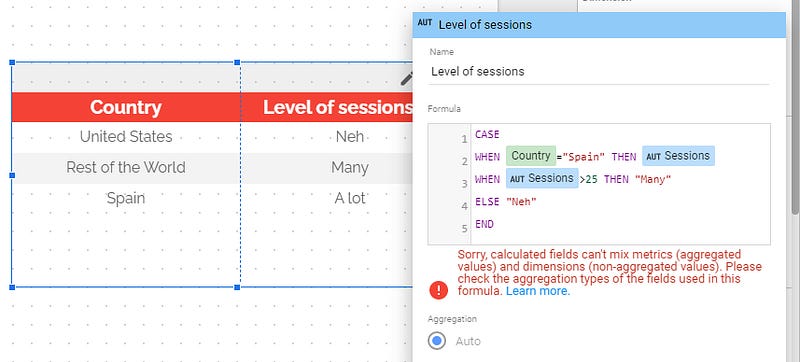
Don’t mix metrics & dimensions in CASE WHEN
I’m really sorry, but you can’t do that:
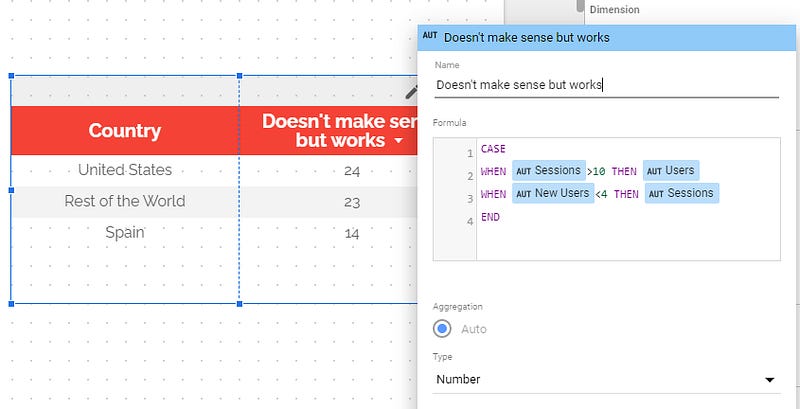
But you can go wild, as long as you keep the same dimension only or metric only level. Like this one. Gives a result, as we stayed at the metric level. It’s just to give you an idea on what you can do here. As long as you don’t mix, your dimensions or metrics can go both in the WHEN and in the THEN statement, and nothing forces you to always use the same:
I hope you got it by now. With this simple SQL statement, you can upgrade your dataviz to the next level in no time!
PROBLEM SOLVED !
Top Looker Studio connectors we love and use on a daily basis (all with free trials): PMA - Windsor - Supermetrics - Catchr - Funnel - Dataslayer. Reviews here and there.
Not sure which one to pick? Have a question? Need a pro to get a project done? Contact us on LinkedIn or by e-mail, and we’ll clear up any doubt you might have.
Looking for Looker Studio courses? We don’t have any… but you can check Udemy!
Communicate and browse privately. Check Proton Mail and Proton VPN
Website hosted by Tropical Server

