How to build a date toggle to easily change date format (year, month, week) in Looker Studio?
What about having a button that allows you to switch year, month, week instantaneously in Looker Studio? Check this out and build yours!
Sometimes, you want to be able to change the date format quickly so you can switch from month to week across all your dataviz at once and get a better grasp at your data. In this article, we’ll review how to a build a date toggle to easily change date format (year, month, week) in Looker Studio (formerly known as Data Studio…hello SEO!).
First, we’ll quickly discuss the drill down feature, which is good for one dataviz once here and there, before building a robust date toggle to do the same, but across all data sources, all data visualizations, all pages, at once. Indeed, quite powerful!
Top Looker Studio connectors we love and use on a daily basis (all with free trials): PMA - Windsor - Supermetrics - Catchr - Funnel - Dataslayer. Reviews here and there.
Not sure which one to pick? Have a question? Need a pro to get a project done? Contact us on LinkedIn or by e-mail, and we’ll clear up any doubt you might have.
Looking for Looker Studio courses? We don’t have any… but you can check Udemy!
Drill down: good to change date format in a single data visualization
You probably already know this one, so I’m going to review it quickly (but if you don’t know it yet, pay attention as it could change your journey as a Looker Studio expert!). Please create a table (works with most dataviz), choose any metric (in my example, Sessions from a GA4 property), and in the setup ribbon, tick the Drill down button under Dimension.
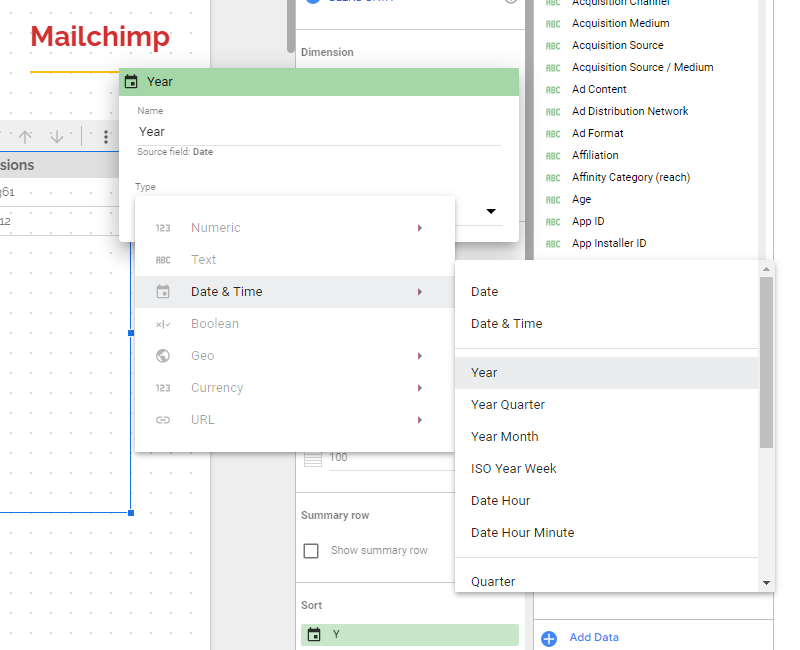
Now, add your Date dimension 3 times (I think by default it’s what Looker Studio does when you click on drill down as it knows where you’re getting at). For the first one, change its name to Year and the type/format to Year:
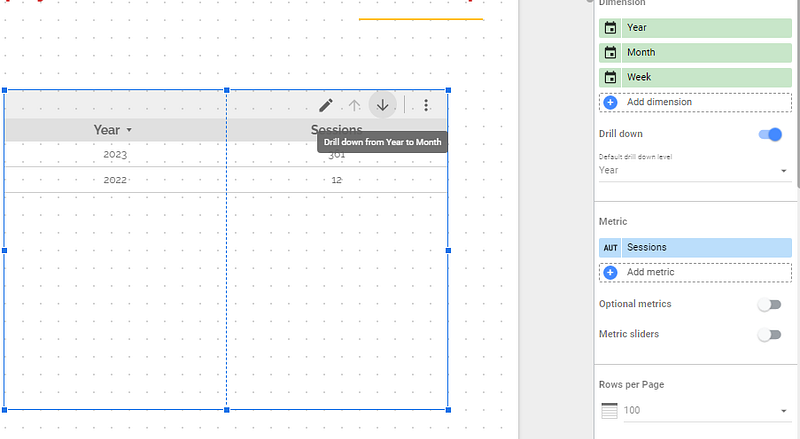
Please repeat the process twice. For the second dimension, name it Month and choose type: Year Month; and for the third dimension, name it Week and set type as ISO Year Week. Then, select your default dimension (when landing on your report, what do you want your users to see first?), and don’t forget to sort by your date dimension.
And voilà, you’ve got a nice drill down. By clicking on the arrows at the top right of your table, your users can switch between Year Month and Month Week:
This was nice. But only works for one data visualization at the time, is there a way to make it work across your page (and even report if you were to set your control at report-level)? Yes, there is! And we’re going to review the steps to smoothly get you there.
1. Create a parameter in your data source
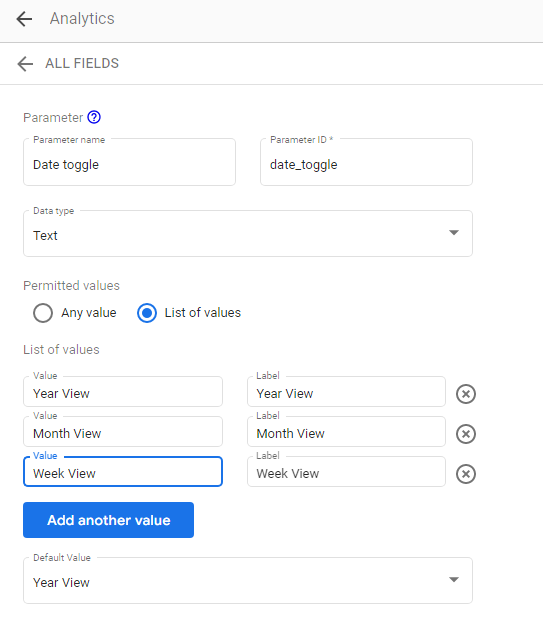
In the top menu, please click on Resource, Manage added data sources, and then Edit the first data source where you want to enable the date toggle (you’ll have to replicate this step if you want the date toggle to control across data sources, using the same parameter name & ID). Then, Add a parameter as follow:
We now have a parameter that will be used in a control you can use to change the date format. We’ve set the “backend” to change the date format, now we need to take care of the “frontend” if you will.
2. Build a calculated field as a dimension
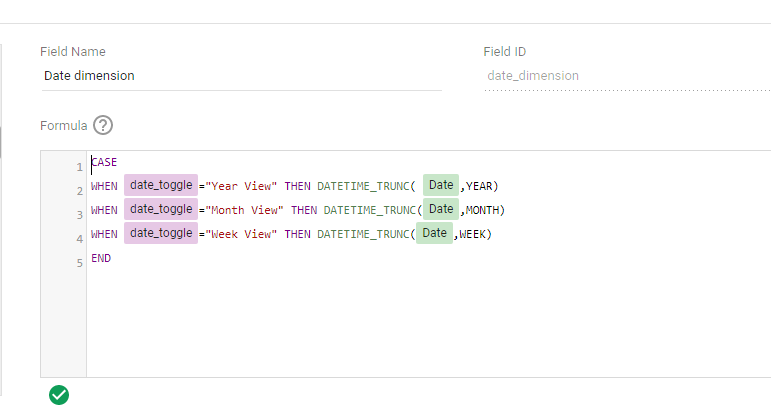
So now, back to your data source. Please Add a formula and use the following formula (please refer to Google Looker Studio documentation to find the right formats that serve your needs), so your dimension is linked to your newly created parameter. When you’ll change your parameter, the truncated date used will change. Again, to make it work across data sources, please create a new field in each data source with the same ID. Very important, SAME ID:
CASE WHEN date_toggle=”Year View” THEN DATETIME_TRUNC( Date,YEAR) WHEN date_toggle=”Month View” THEN DATETIME_TRUNC(Date,MONTH) WHEN date_toggle=”Week View” THEN DATETIME_TRUNC(Date,WEEK) END
3. Add a fixed-size control using your parameter
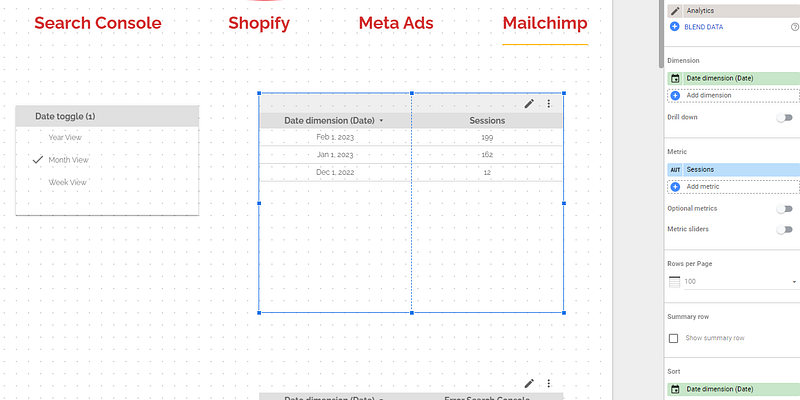
We’re getting there. In your report, please Add a control, choosing the fixed-sized one, and as per the Control field choose the parameter we created in step 1.
And eventually, back to your table, please untick the drill down, delete all dimensions, and put the field we created in step 2 (make sure to use it to sort).
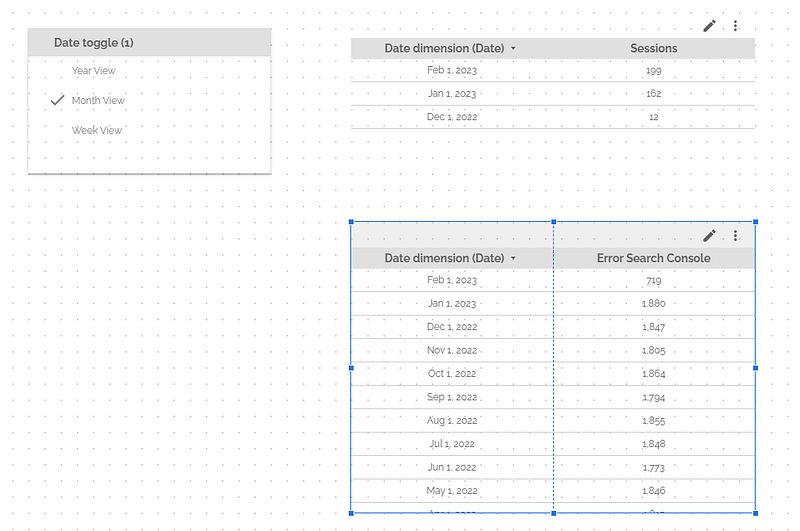
You can now play with your control, and you’ll see that your table gets updated accordingly. Damn nice, right?!
4. Replicate across data sources
Remember, by using the same parameter ID and field ID across data sources (so you need to repeat step 1. & 2. on each data source), you can use one control to master all dataviz in your page. And if you were to make your control report-level, it will control all dataviz all pages!
In this article, we’ve reviewed how to build a date toggle to control the level of precision in all your dataviz, at once. As per the control formatting to make it look good, I leave it to you.
PROBLEM SOLVED !
Top Looker Studio connectors we love and use on a daily basis (all with free trials): PMA - Windsor - Supermetrics - Catchr - Funnel - Dataslayer. Reviews here and there.
Not sure which one to pick? Have a question? Need a pro to get a project done? Contact us on LinkedIn or by e-mail, and we’ll clear up any doubt you might have.
Looking for Looker Studio courses? We don’t have any… but you can check Udemy!
Communicate and browse privately. Check Proton Mail and Proton VPN
Website hosted by Tropical Server

Hello, I need some assistance with Looker Studio. I’ve connected Google Ads with Looker Studio and created a Line chart displaying daily impressions. I’ve also added a page-level Date Range control, so when a user selects a range (e.g., January 1st to January 31st, 2026), the chart updates to show data for that specific date range on a daily basis.
Additionally, I’ve enabled drill-down functionality, so when users switch to the "Month" option, the chart should show only the data for the selected month (e.g., January 2026) based on the date range selected. However, I need the drill-down to show data for the entire year when the user selects a month.
Is it possible to implement this functionality in Looker Studio? If yes, can you guide me through the steps to achieve it?
Thank you!