
How to use parameters in Looker Studio?
Parameters can be very powerful in Looker Studio when it comes to querying databases, here’s how to use them !
Ever wondered if it was possible to give control back to your final users in your Looker Studio (or Data Studio)? Well it is! You just need to use parameters, as simple as that, and from there they’ll be able to run queries on the data they want to see, and even interact dynamically with your dataviz.
In this article, we’ll review what parameters are good for and how to use them, along with a few examples. Food for thoughts!
Looker Studio connectors we use on a daily basis and are happy with (w/ free trials): Supermetrics - Windsor - Catchr - PMA - Funnel (some affiliate links, still good tools!)
Not sure which one to pick? Reviews here and there. Still unsure?! Contact us with your tech stack and budget, and we’ll guide you in the right direction:
What are parameters good for?
There are three main cases to justify the use of parameters:
When working with custom queries connectors to databases (think BigQuery. But postgresql doesn’t support it for instance), you can limit the scope of your query by using your parameters as a filter. It can be very efficient when you’re dealing with big tables, not only increasing speed but also reducing costs (which is always nice, right? well, you’re welcome)
If you’re hosting several clients data in the same table, you don’t want them to be able to query everything. Instead of creating one dashboard per client, you can use a single master dashboard, and provide to each of your client an encrypted key to use in the report. Very unlikely they’ll find other clients key, hence no way for them to query other people’s data, everything’s secured (obviously, if it’s client 1 id=1, client 2 id=2,…, it won’t be that secured…)
Last but not least, when you’re running calculations in a dataviz, you may want to let your users interact and play around. Using a parameter can exactly let you do that!
Add a parameter to a database data source
First, let’s review how to add a parameter to a simple custom query. We’ll be using Big Query here (please note that not all database connections accept parameters).
Please create a new Big Query Custom Query datasource, in this example we’re going to be very basic:

Once you’ve added your data source, please Edit it through Resource, Manage added data sources, and click at the top right of your screen to Add a Parameter.
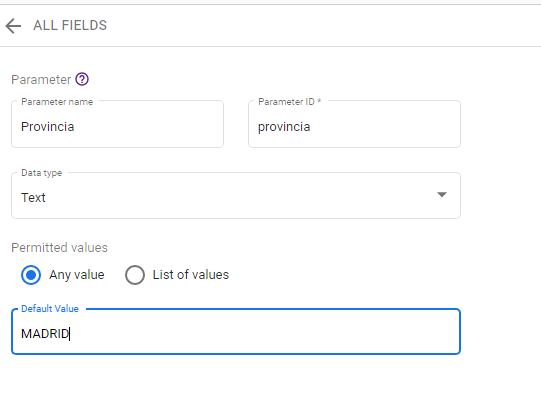
It will open the following box, in which you can input as follow:
The name of your parameter, what you want it to be displayed in the report
The ID: important here, this is what you will add in your custom query. Plus, if you use the same ID across queries (for every data source you’ll to create a parameter), you’ll be able to filter several data sources at once!
The format, text or number
And then, you can let your users enter any value, or manually input a list of values along with their labels
Last but not least, you can choose a Default Value, the one selected when the final user lands on your report
Now save, and you’re all set, you’ve just created your first parameter!
We now need to insert it into the custom query. Nothing’s simpler, let’s Edit again your data source, go to Edit Connection, insert the parameter using the @ symbol where it belongs, and save changes. It will prompt you that there is a change to your connection, and that’s it.

Back to your report, please add an Input box control, and choose your parameter as the Control field.
That’s it, we’re all set, every time your users changes the parameter, it will re-run the query on the data s/he wants to see.
Was quite easy right? In case you added a limited list of values, it will be better to use a Drop-down list control rather than an Input box.

Managing several users data into the same table
As mentioned earlier, you can use parameters for security reasons.
Maybe you’ve got one table with several clients’ data, but you want to let each client only access its data.
Well, you can simply do the same as seen previously, but using as a parameter an encrypted key of your own that is unique to each client, and complicated enough so they can’t guess other client’s key.
To maximize security in this case, please set the default value to -1, so by default users don’t see anything until they’ve inputted their key.
Not ideal for them, but a good solution for you.
Playing with dataviz
On the same dataviz, let’s create another parameter, but numerical (decimal) this time. We’re going to call it play with numbers (why not), and constrain it in a 0 to 10 range as follow:

Use it in the input box, create a table using the same data source, and in the Setup ribbon, Add a metric using any formula based on your parameter, like this. You’ll notice that metrics are green, and parameters are purple, an easy way to differentiate them:

And that’s it! Every time your users will update the parameter in the input box, the calculation will get updated in the table.
Want to see a live example of this? Try this looker studio report we’ve built on Spanish housing market, all dataviz are dynamic thanks to a lot of parameters!
In this article, we’ve reviewed how to make the best use of parameters in Looker Studio & Data Studio, shall it be for performances, security or user experience purposes. From there, think about how you could implement that in your reports. Sky is the limit :)
PROBLEM SOLVED !
The infamous affiliate links section. Still, these are tools we do use and do like a lot. To be said, we use other tools we’d rather not publicize given the headache they cause!
Todoist: for tasks management
Clickup: for projects management, when tasks fall short
Monday: for CRM & automation
Tropical Server: our friends in charge of the hosting of this very website!
Tools we use through clients’ accounts (and we’d use internally if we had the budget…):